Microeconomics
1.1.1 The economic problem
The market system
The problem of scarcity
The problem of scarcity: where there are unlimited wants and finite resources, leading to the need to make choices.
Wants: The desire for goods and services.
Needs: basic requirements for human survival.
Finite resources
Every country has resources, such as land, water, minerals and people. But the amount of each resource is finite, which means it has an end or a limit. With only a limited supply, economists call resources scarce. Land, labour, capital and enterprise, the four factors of production, are all scarce resources (see 1.2.1).
Unlimited wants
Needs, such as food, water, shelter and clothing, must be met for people to survive. Wants go further, e.g. a bigger house, more holidays or a better car. Wants are unlimited, because people always want more, whatever they already have. Many things also wear out or are replaced by newer, more fashionable versions, so people keep wanting them again.
Why scarcity leads to choices
Resources are finite, so people want more resources than there are available. Some wants will always go unmet, so people must choose how to use scarce resources.
The economic problem: what, how and for whom to produce when there are finite resources to meet infinite wants.
The three questions every economy must answer:
- What to produce: a country cannot produce everything people want, so it must decide which goods and services to make, e.g. more schools or more cars.
- How to produce: the same goods can be made in different ways, e.g. using lots of workers or using high-tech machinery.
- For whom to produce: the country must decide how the goods are shared out, e.g. whether everyone gets the same amount or some people get more.
Example: A small island has a fixed amount of land and fresh water. Its people want more homes, a bigger airport, more hotels for tourists and more land for farming. There is not enough land and water for all of these, so the island’s government has to choose what to use them for.
Opportunity cost
Opportunity cost: The cost of the next best alternative given up (when making a choice).
Every choice involves a sacrifice. If you rank your options from best to worst, the opportunity cost is what you miss out on from the option ranked second. It is only the next best alternative, not everything you could have chosen.
Example: Leila has $60 to spend. Her first choice is a concert ticket, her second choice is a new pair of trainers and her third choice is a meal out with friends. She buys the concert ticket, so her opportunity cost is the trainers. The meal out is not part of her opportunity cost.
The effect of opportunity cost on economic agents
Consumers, producers and the government are economic agents. They all have limited money and resources, so they all face opportunity costs.
How opportunity cost affects each economic agent:
- Consumers: they have a limited budget, so buying one product means going without another.
- Producers: firms cannot afford every project, so choosing one, e.g. a new delivery vehicle, may mean they cannot buy new machinery or hire more workers.
- Government: money spent on one area, e.g. healthcare, cannot also be spent on another, e.g. education.
Ranking the options in order of preference helps each economic agent see exactly what it is giving up.
Example: one choice for each economic agent
- Consumer: Omar spends $300 on a new phone. His opportunity cost is the bicycle he wanted to buy next.
- Producer: a bakery spends $8 000 on a new oven. Its opportunity cost is the advertising campaign it can no longer afford.
- Government: a government spends $50 million on new roads. Its opportunity cost is the extra healthcare it could have paid for instead.
Production possibility curves
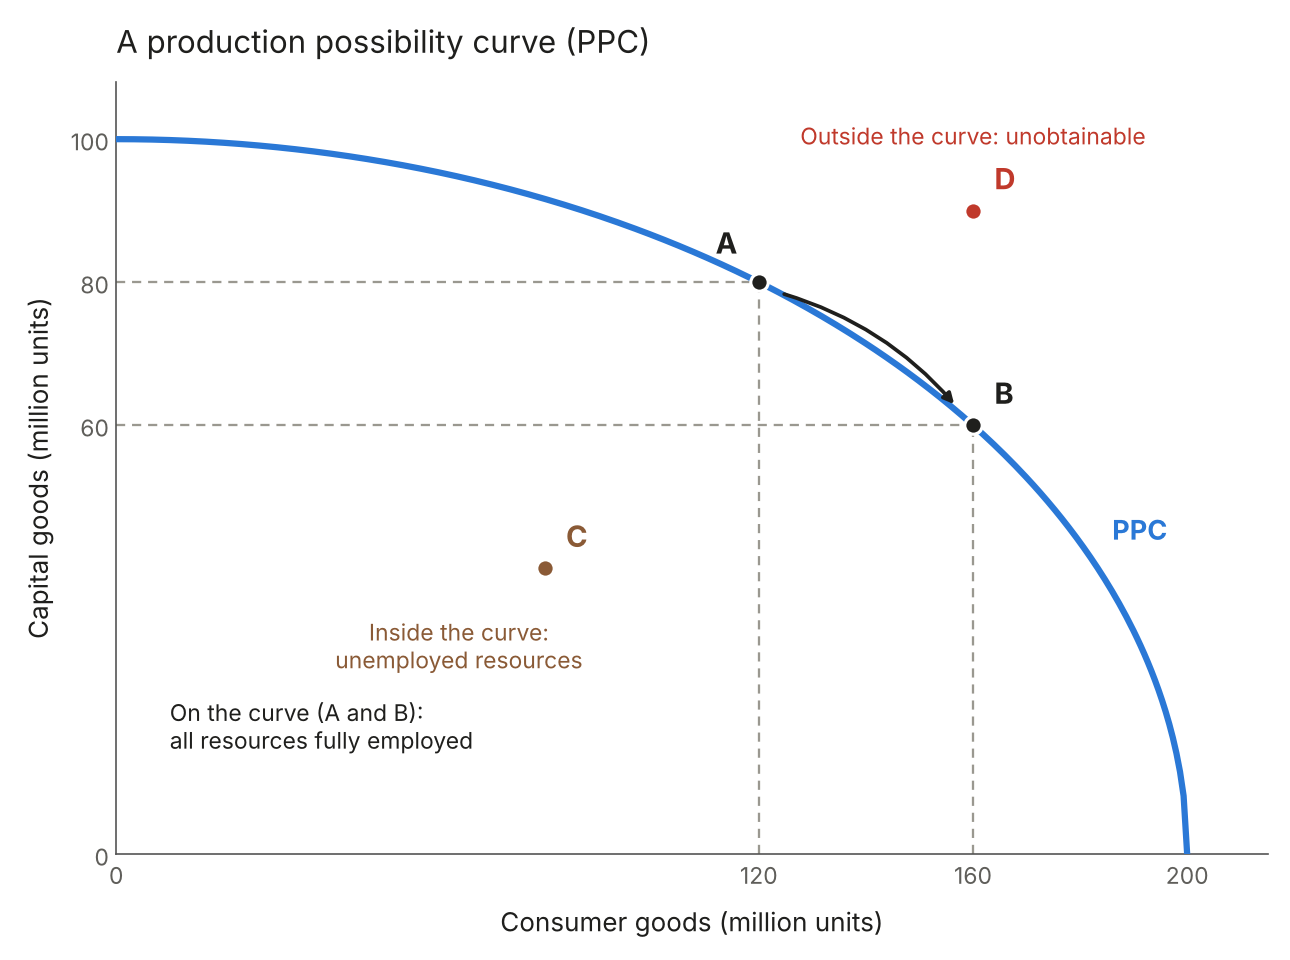
Production possibility curve (PPC): shows the combinations of goods which can be produced with all available resources.
It is also called a production possibility frontier (PPF). The curve marks the most an economy can make of each combination of the two goods.
The two types of goods often shown:
- Capital goods: those purchased by firms and used to produce other goods, such as factories, machinery, tools and equipment.
- Consumer goods: those purchased by households, such as food, cars, tablets and furniture.
What a PPC shows
- Maximum productive potential: each point on the curve, e.g. A or B, is the most the economy can produce with the resources it has.
- Fully employed resources: at any point on the curve, all resources are being used.
- Unemployed resources: at a point inside the curve, e.g. C, some resources are not being used, so the economy could produce more.
- Possible and unobtainable production: any point on or inside the curve is possible. A point outside the curve, e.g. D, is unobtainable, as the economy does not have enough resources to produce it.
- Opportunity cost: moving along the curve, e.g. from A to B, means producing more of one good but less of the other. The output given up is the opportunity cost.
Example: moving from A to B
At point A, the economy produces 120 million units of consumer goods and 80 million units of capital goods. It moves to point B, where it produces 160 million units of consumer goods and 60 million units of capital goods.
- Extra consumer goods: 160 – 120 = 40 million units.
- Opportunity cost: 80 – 60 = 20 million units of capital goods.
The opportunity cost is always measured in units of the good that is given up, here capital goods.
Choosing between capital goods and consumer goods
Producing more capital goods today means fewer consumer goods now, so people go without some things in the short term. However, capital goods are used to make other goods, so the economy can produce more in the future. Its PPC shifts outwards, allowing more of both goods.
Drawing a PPC
What a PPC diagram needs:
- Both axes labelled with the two goods, e.g. capital goods and consumer goods
- A curve running from one axis to the other
- A change in what is produced shown as a movement along the same curve, with less of one good and more of the other
- Every curve labelled if there is more than one, e.g. PPC1 and PPC2
Economic growth on a PPC
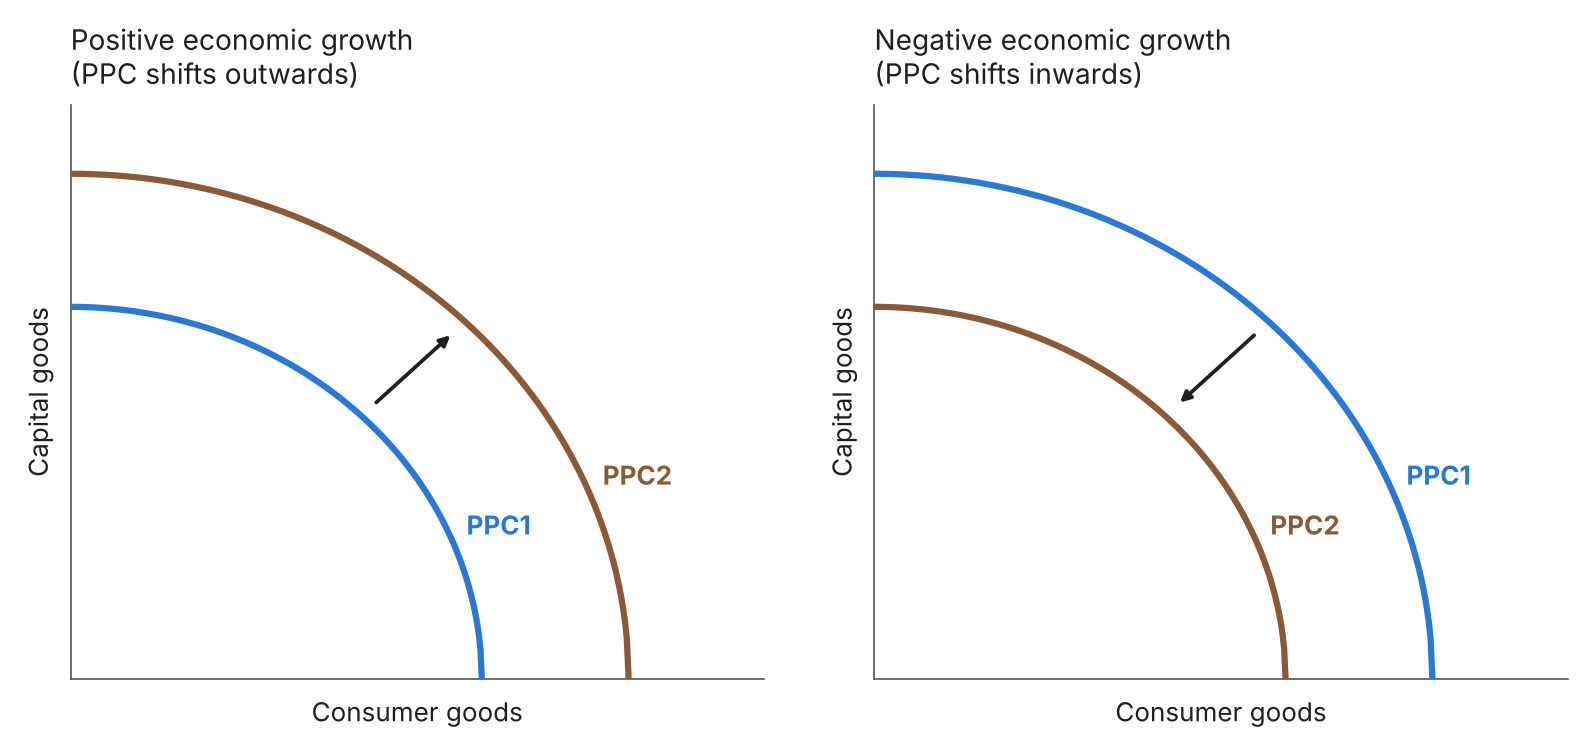
Economic growth: The increase in the level of output by a nation.
- Positive economic growth: the PPC shifts outwards, e.g. from PPC1 to PPC2. The economy can now produce more of both goods, and some combinations that were unobtainable become possible.
- Negative economic growth: the PPC shifts inwards. The economy’s productive potential falls, so it can produce less of both goods.
Causes of positive and negative economic growth
Causes of positive economic growth (the PPC shifts outwards):
- New technology: new machines, such as robots and computers, are faster and more reliable, so more output can be produced.
- Improved efficiency: better production methods produce more output with fewer resources.
- Education and training: better-educated, more skilled workers can carry out tasks more efficiently.
- New resources: finding new resources, e.g. new oil reserves, allows a country to produce more.
Causes of negative economic growth (the PPC shifts inwards):
- Resource depletion: a natural resource, such as oil or coal, is used up.
- Weather: e.g. very dry weather can stop a country producing as much from farming.
- Skilled workers leaving: highly skilled workers move to other countries to earn more.
- Wars, conflict and natural disasters: these can reduce how much a country is able to produce.
Example: two countries
- Country A: it puts robots in its factories and trains more engineers. Its PPC shifts outwards, so it can make more consumer goods and more capital goods.
- Country B: its main gold mine runs out and many of its doctors move abroad for higher pay. Its PPC shifts inwards, so it can produce less of both.

