Government and Economy
2.1.1 Economic growth
Government and the economy
Macroeconomic objectives
Macroeconomics studies the whole economy, e.g. total output, total employment and the general level of prices. When managing the economy, a government has a set of aims called macroeconomic objectives.
The six macroeconomic objectives:
- Economic growth
- Low and stable inflation
- Low unemployment
- A surplus or balance on the current account of the balance of payments
- Protection of the environment
- Redistribution of income
Economic growth
Economic growth: The increase in the level of output by a nation.
When an economy grows, firms produce more and need more workers. As more people find jobs, incomes rise, so people spend more, which pushes growth even higher.
Measuring economic growth using GDP
Gross domestic product (GDP): the market value of all goods and services produced in a year.
GDP only counts final goods and services. Parts that go into another product are not counted separately. Exports are included, as they are made in the country, but imports are not, as they are made abroad. Because almost every country measures growth using GDP, growth rates can be compared between countries.
Economic growth is the percentage increase in GDP. If GDP falls, the growth rate is negative.
Formula:
% change in GDP = (GDP this year – GDP last year) ÷ GDP last year × 100
Give the answer as a percentage, with the % sign, usually to two decimal places.
Example: A country’s GDP rises from $512 billion to $530 billion. Economic growth = ($530bn – $512bn) ÷ $512bn × 100 = 3.52%.
Limitations of GDP as a measure of growth
- Inflation: if prices rise, GDP goes up even when no extra output is produced. Real GDP adjusts for inflation, so it shows the true growth rate.
- Population changes: if the population grows, the extra GDP is shared between more people. GDP per capita (GDP ÷ population) allows for this.
- Statistical errors: collecting the data is a huge task, and some information is entered wrongly or left out, so nobody knows the exact value of GDP.
- Home-produced goods: goods and services that are not sold, e.g. growing your own vegetables or doing your own DIY, are not recorded.
- The hidden economy: some paid work is done for cash and never recorded, e.g. a neighbour paid $40 in cash to fix a fence.
- Living standards: a rise in GDP does not always mean people are better off. It ignores how much leisure time people have, how the extra income is shared, whether growth has caused pollution and how good the products are.
- External costs: GDP ignores environmental costs, such as pollution, and how they affect people’s well-being.
Example: inflation and population
- Real GDP: a country’s GDP rises by 5.0% in a year, but prices rise by 3.2%. Real GDP has only grown by 5.0% – 3.2% = 1.8%.
- GDP per capita: the same country has a GDP of $530 billion and a population of 25 million. GDP per capita = $530bn ÷ 25m = $21 200.
The economic cycle
GDP usually grows over time, but not smoothly. It rises and falls around its long-term trend rate in a pattern called the economic cycle, also known as the trade cycle or business cycle.
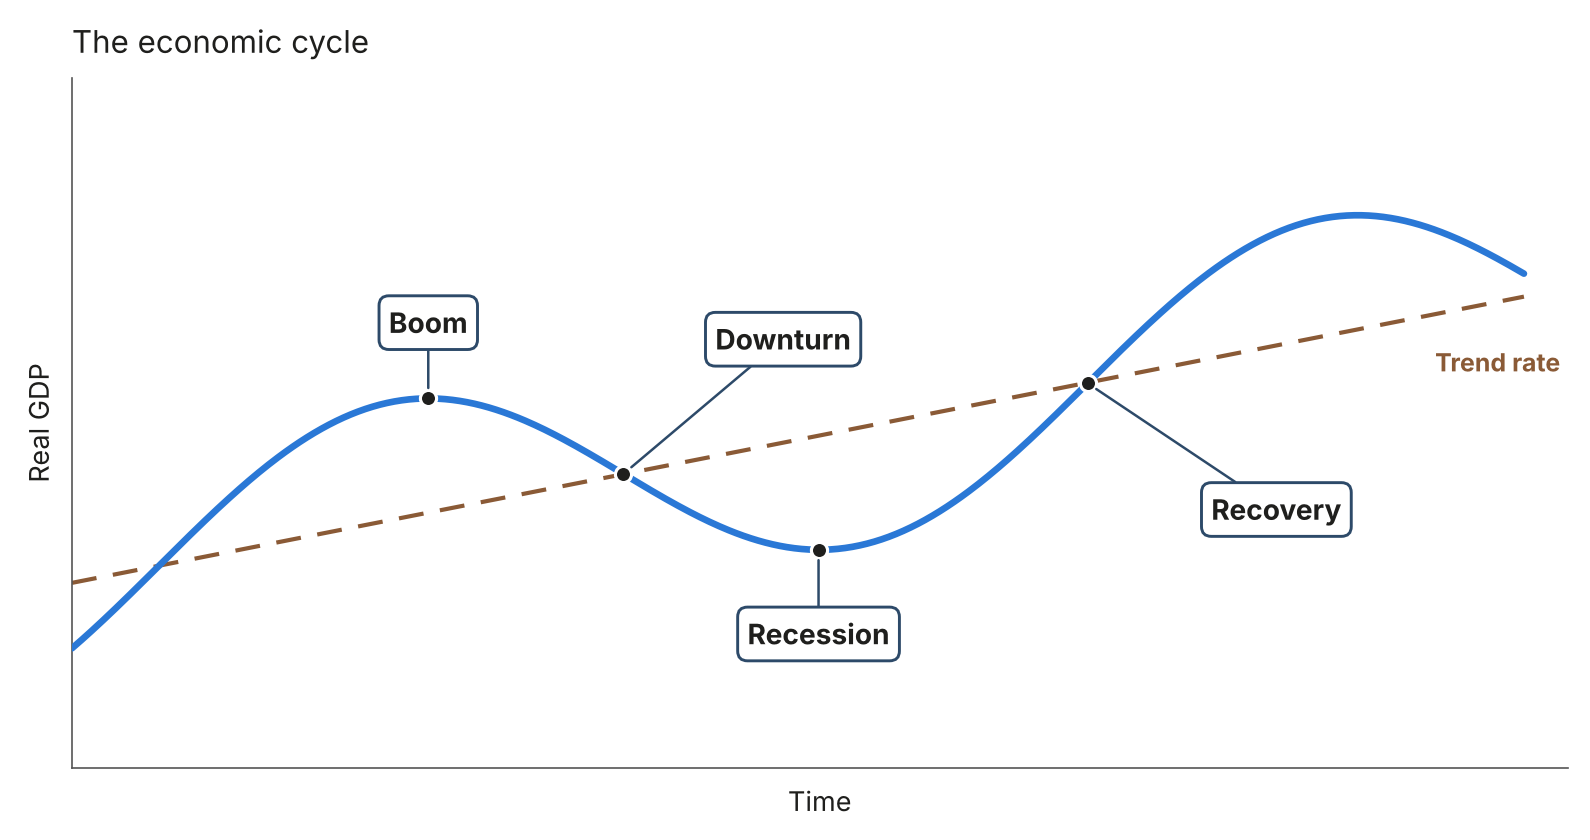
Boom: A phase in the economic cycle with the highest levels of economic activity.
Downturn: A period where GDP is still growing but more slowly.
Recession: A fall in GDP for two successive quarters.
Recovery: A phase in the economic cycle where GDP starts to rise again.
A very deep recession, with GDP falling and unemployment rising sharply, is called a depression or slump.
Drawing the economic cycle
What the diagram needs:
- Real GDP on the vertical axis and time on the horizontal axis
- A wavy line rising and falling around a straight trend rate line
- The four stages labelled in order: boom at the peak, downturn as GDP growth slows, recession at the bottom and recovery as GDP rises again
- Recession can also be labelled depression or slump, but the other three stages must use these exact names
The effect of each stage on growth, inflation and unemployment
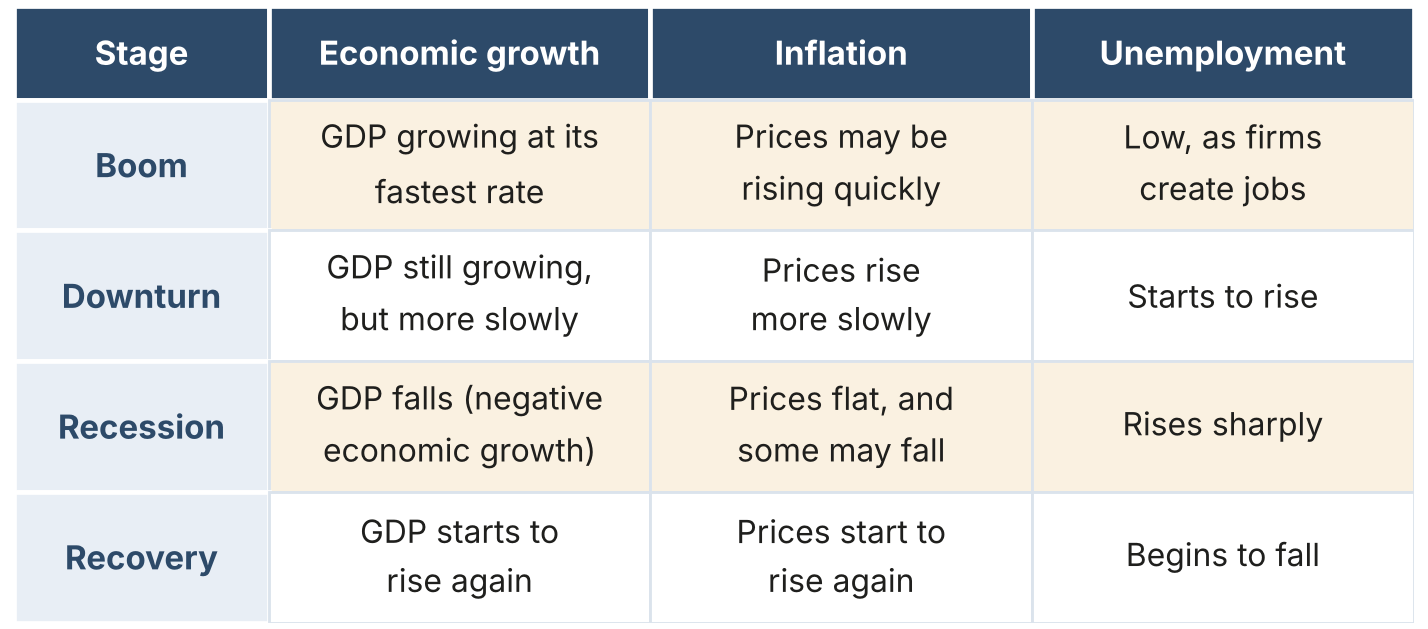
Why each stage has these effects:
- Boom: demand is rising, existing firms expand and new firms join the market, so jobs are created and wages rise. Prices may rise quickly too.
- Downturn: demand stops rising or starts to fall. Many firms stop expanding and some leave the market, so unemployment starts to rise and prices rise more slowly.
- Recession: households and firms cut their spending, especially on non-essentials. Firms need fewer workers, so unemployment rises sharply. Lower demand also keeps prices flat, and some may fall.
- Recovery: consumers and businesses regain confidence, so spending rises. Firms produce more and hire more workers, so unemployment falls and prices start rising again.
Example: A country’s GDP falls for two quarters in a row, so it is in recession. Car sales drop, a car factory cuts 600 jobs and shops offer discounts to attract customers. A year later, GDP starts to rise again. The factory takes on new workers and the shops stop discounting, as the economy moves into recovery.
The impact of economic growth
- Employment: firms producing more output need more workers, so unemployment falls. Government spending usually rises as well when the economy grows, creating jobs in areas such as education and healthcare.
- Standards of living: people have more income on average, so they can afford more and better goods and services, e.g. better food and housing. Growth has also allowed people to work fewer hours and to live longer.
- Poverty: new and expanding firms create jobs, and some of these go to poorer people. A growing economy also brings the government more tax revenue, which it can spend on healthcare, education and support for the poor.
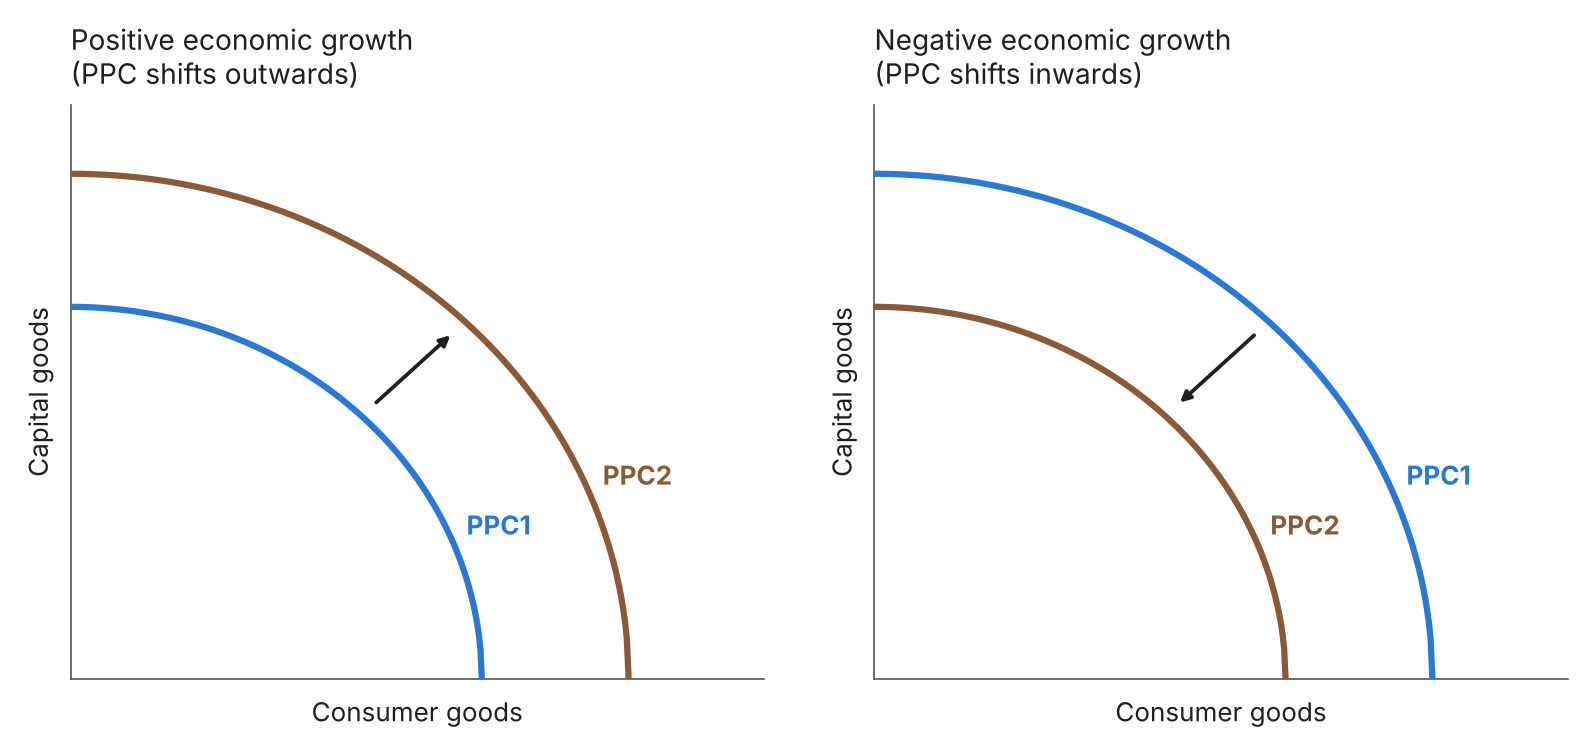
- Productive potential: the economy is able to produce more goods and services. This is shown by the production possibility curve shifting outwards.
- Inflation: if growth is too fast, demand may rise faster than supply can keep up, so prices rise. The economy is said to overheat.
- The environment: more production and more cars and flights mean more pollution. Growth also depletes non-renewable resources, e.g. oil and gas, leaving fewer for future generations. Growth that cannot continue without harming the environment is called unsustainable growth.
Example: a country growing at 7% a year
- Benefits: new factories open and hire thousands of workers, families can afford better housing, and the government uses its higher tax revenue to build new schools and clinics.
- Costs: house prices and rents rise quickly, and traffic and air pollution in the main cities get worse.

