Microeconomics
1.1.3 Demand, supply and market equilibrium
The market system
Demand
Demand: The quantity of goods/services consumers are willing and able to buy at a given price.
Both parts matter. Wanting a product is not enough on its own. Consumers must also have the money to pay for it, so demand only counts people who would actually buy at that price.
Example: Many students would like a new games console that costs $500. Only those who can afford it and choose to spend their money on it are part of the demand for the console at $500.
The demand curve
Demand curve: line drawn on a graph that shows how much of a good will be bought at different prices.
Price is plotted up the vertical axis, with quantity along the horizontal axis. The demand curve slopes down towards the right, which shows an inverse relationship: as the price rises, people buy less, and as it falls, they buy more.
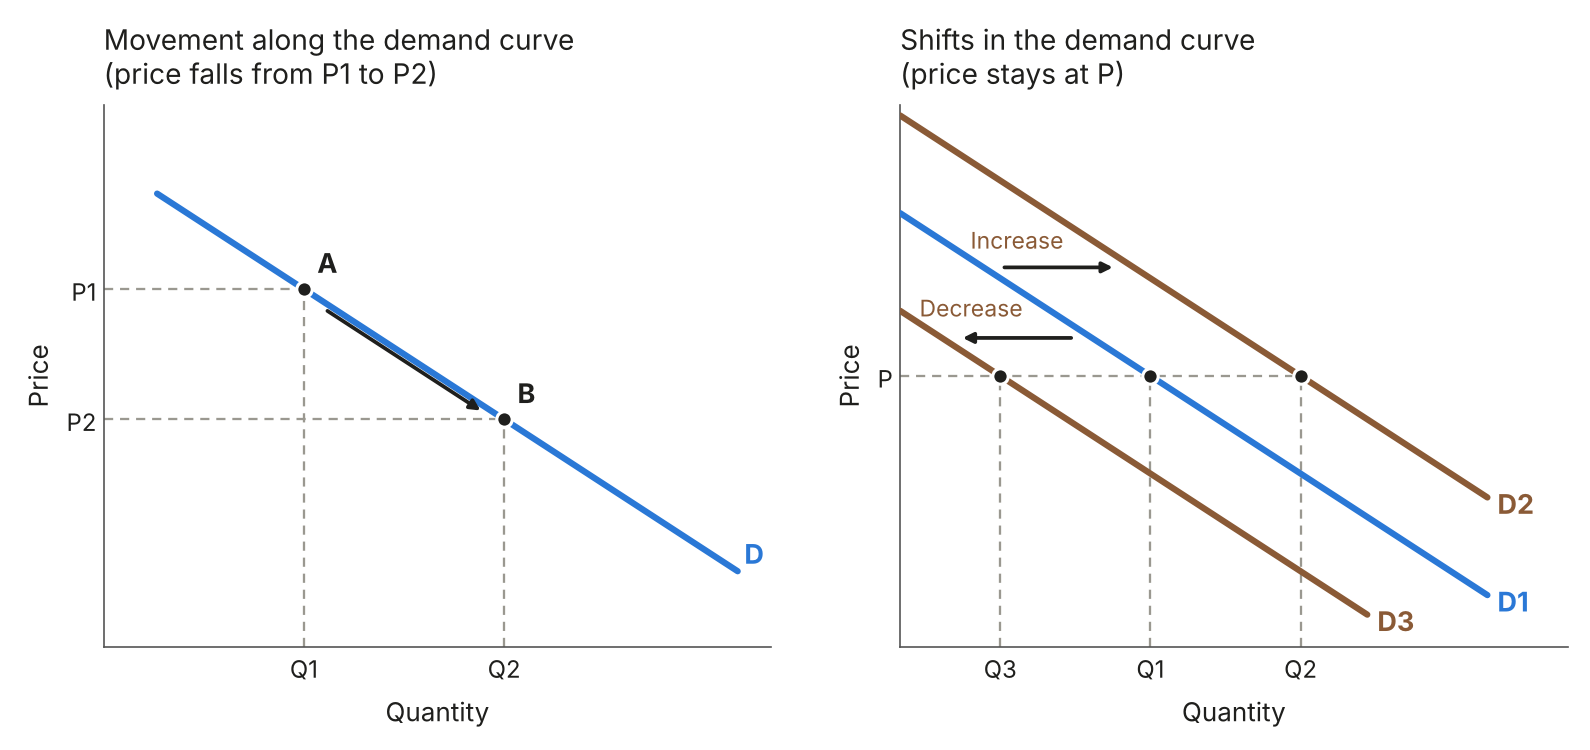
Movement along the demand curve
A change in the price of the good itself causes a movement along the same demand curve. In the diagram, a fall in price from P1 to P2 moves the market from A to B, so the quantity demanded rises from Q1 to Q2. A rise in price would move it the other way.
Shifts in the demand curve
A change in any factor other than the good’s own price moves the whole demand curve to a new position.
The two ways a demand curve can shift:
- Increase in demand: the curve moves right, to D2. People buy more at each price, e.g. Q2 instead of Q1 at price P.
- Decrease in demand: the curve moves left, to D3. People buy less at each price, e.g. Q3 instead of Q1 at price P.
Example: a bubble tea shop
- Movement along the curve: the shop cuts its price from $5 to $4 a cup, and weekly sales rise from 300 to 400 cups.
- Shift of the curve: the shop then starts advertising on social media. At the same price of $4, it now sells 550 cups a week, so the whole demand curve has shifted to the right.
Factors that shift the demand curve
Substitute: An alternative bought/produced in place of something else.
Complementary goods: goods purchased together because they are consumed together.
Six factors that can shift the demand curve:
- Advertising: more advertising persuades more people to buy, so demand shifts to the right. A fall in advertising shifts it to the left.
- Income: when incomes rise, people can afford more, so demand for most goods shifts to the right. When incomes fall, it shifts to the left. For a few goods, called inferior goods, demand falls as incomes rise, e.g. cheap own-brand food, as people switch to more expensive brands.
- Fashion and tastes: when a product becomes more fashionable or popular, demand shifts to the right. When it goes out of fashion, demand shifts to the left. Tastes can be changed by things like celebrities or new health information.
- Price of substitute goods: if a substitute becomes cheaper, some consumers switch to it, so demand for the product shifts to the left. If a substitute becomes more expensive, demand shifts to the right.
- Price of complementary goods: if a complement becomes more expensive, demand for the product shifts to the left, e.g. dearer tennis rackets reduce demand for tennis balls. If a complement becomes cheaper, demand shifts to the right.
- Demographic changes: changes in the size or structure of the population. A bigger population, e.g. from a higher birth rate or immigration, increases demand for many goods. Changes in the age, gender, location or ethnic mix of the population change which goods are wanted, e.g. an ageing population needs more healthcare.
Each factor can shift demand either way, so the direction of the change matters. A rise in income shifts demand to the right, but a fall in income shifts it to the left.
Example: demand for electric scooters in a city
- Advertising: a scooter brand launches a big online campaign, so demand shifts to the right.
- Income: a recession cuts people’s wages, so demand shifts to the left.
- Fashion and tastes: scooters become popular with students, so demand shifts to the right.
- Substitutes: the city cuts bus fares, so some people take the bus instead and demand shifts to the left.
- Complements: the price of replacement batteries rises, so demand shifts to the left.
- Demographic changes: a new university brings thousands of young people to the city, so demand shifts to the right.
Supply
Supply: The quantity of goods or services producers are willing and able to sell at a given price/at a given time.
Again, both parts count. A producer must want to sell at that price and must also be able to make or provide the goods.
The supply curve
Supply curve: shows how much of a good that producers are willing and able to supply at different prices over time.
The supply curve rises from left to right. When the price goes up, producers offer more for sale, and when it goes down, they offer less.
Why more is supplied at higher prices:
- More profit: a higher price lets existing firms earn more profit, so they are willing to produce more.
- New firms: a higher price attracts new firms into the market, as they also expect to make a profit.
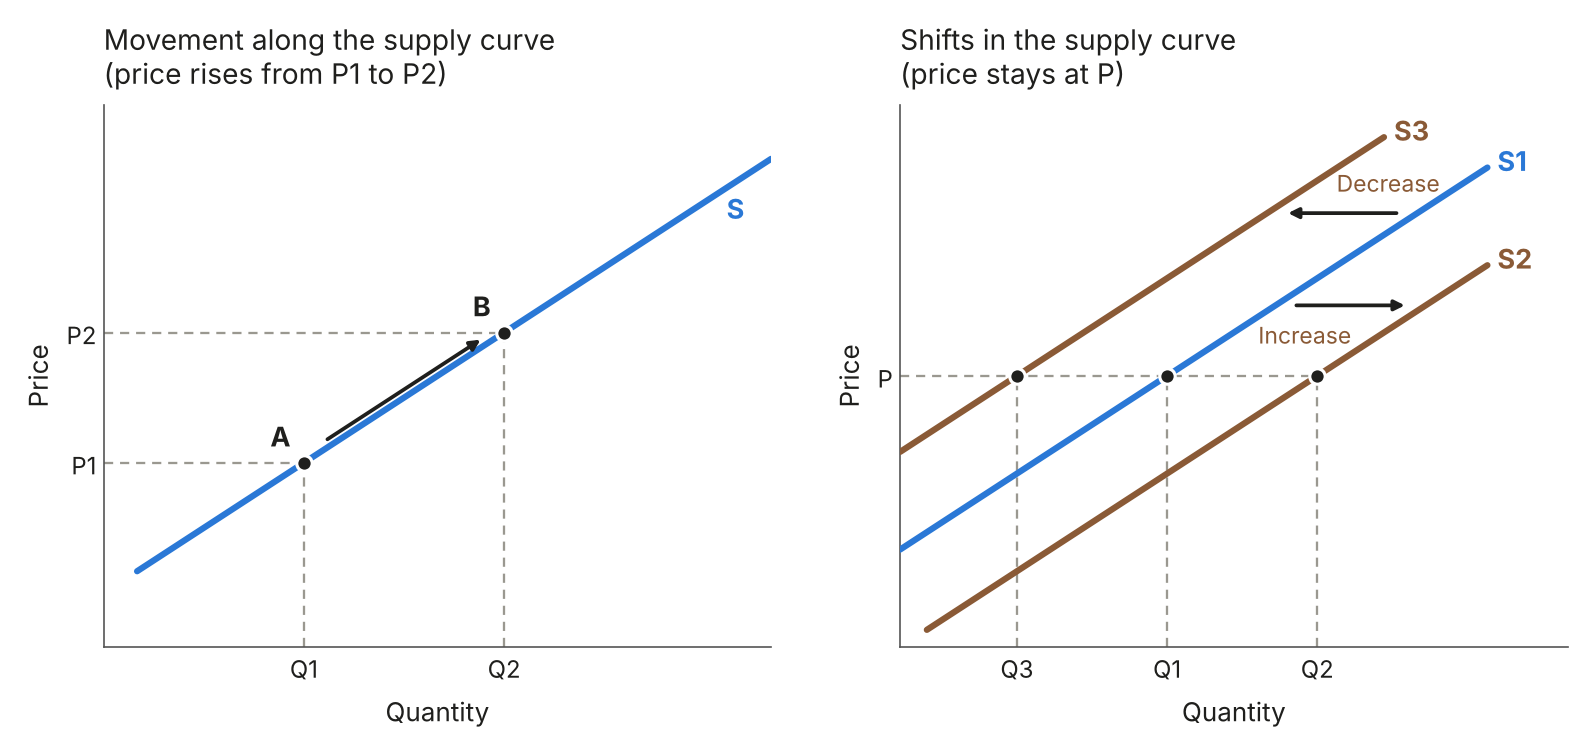
Movement along the supply curve
A change in the price of the good itself causes a movement along the same supply curve. In the diagram, a rise in price from P1 to P2 moves the market from A to B, so the quantity supplied rises from Q1 to Q2.
Shifts in the supply curve
Any other change, such as a rise in production costs, moves the whole supply curve.
The two ways a supply curve can shift:
- Increase in supply: the curve moves right, to S2. Firms offer more for sale at each price.
- Decrease in supply: the curve moves left, to S3. Firms offer less for sale at each price.
Example: a strawberry farm
- Movement along the curve: the market price of strawberries rises from $3 to $4 a box, so the farm picks more and sells 700 boxes a week instead of 500.
- Shift of the curve: the farm’s workers then get a pay rise. At the same price of $4, the farm now only supplies 600 boxes a week, so its supply curve has shifted to the left.
Factors that shift the supply curve
Indirect taxes: taxes levied on spending, such as VAT.
Subsidy: money that is paid by a government or organisation to make prices lower, reduce the cost of producing goods or providing a service, usually to encourage production of a certain good.
Five factors that can shift the supply curve:
- Costs of production: e.g. wages, raw materials, energy and rent. If costs rise, each unit earns less profit, so firms supply less and the curve shifts to the left. If costs fall, it shifts to the right.
- Changes in technology: new technology makes production more efficient and lowers costs, so firms supply more and the curve shifts to the right.
- Indirect taxes: a tax adds to firms’ costs. Introducing or raising an indirect tax shifts supply to the left. Cutting or removing one shifts it to the right.
- Subsidies: a subsidy lowers firms’ costs, so a new or larger subsidy shifts supply to the right. Cutting or removing a subsidy shifts it to the left.
- Natural factors (natural disasters and weather): these matter most in farming. Good weather can bring a bigger harvest, so supply shifts to the right. Droughts, floods or hurricanes can destroy crops and equipment, so supply shifts to the left.
As with demand, the direction matters. A rise in an indirect tax shifts supply to the left, but a cut shifts it to the right.
Example: supply of coffee beans
- Costs of production: the price of fertiliser rises, so supply shifts to the left.
- Changes in technology: farmers start using machines that harvest the beans faster, so supply shifts to the right.
- Indirect taxes: the government puts a new tax on coffee sales, so supply shifts to the left.
- Subsidies: the government pays farmers $200 for every hectare of coffee they plant, so supply shifts to the right.
- Natural factors: a frost destroys part of the crop, so supply shifts to the left.
Market equilibrium
Equilibrium price: the price at which the quantity supplied equals the quantity demanded.
The amount bought and sold at this price is the equilibrium quantity. On a diagram, both are found where the demand and supply curves cross, shown as Pe and Qe.
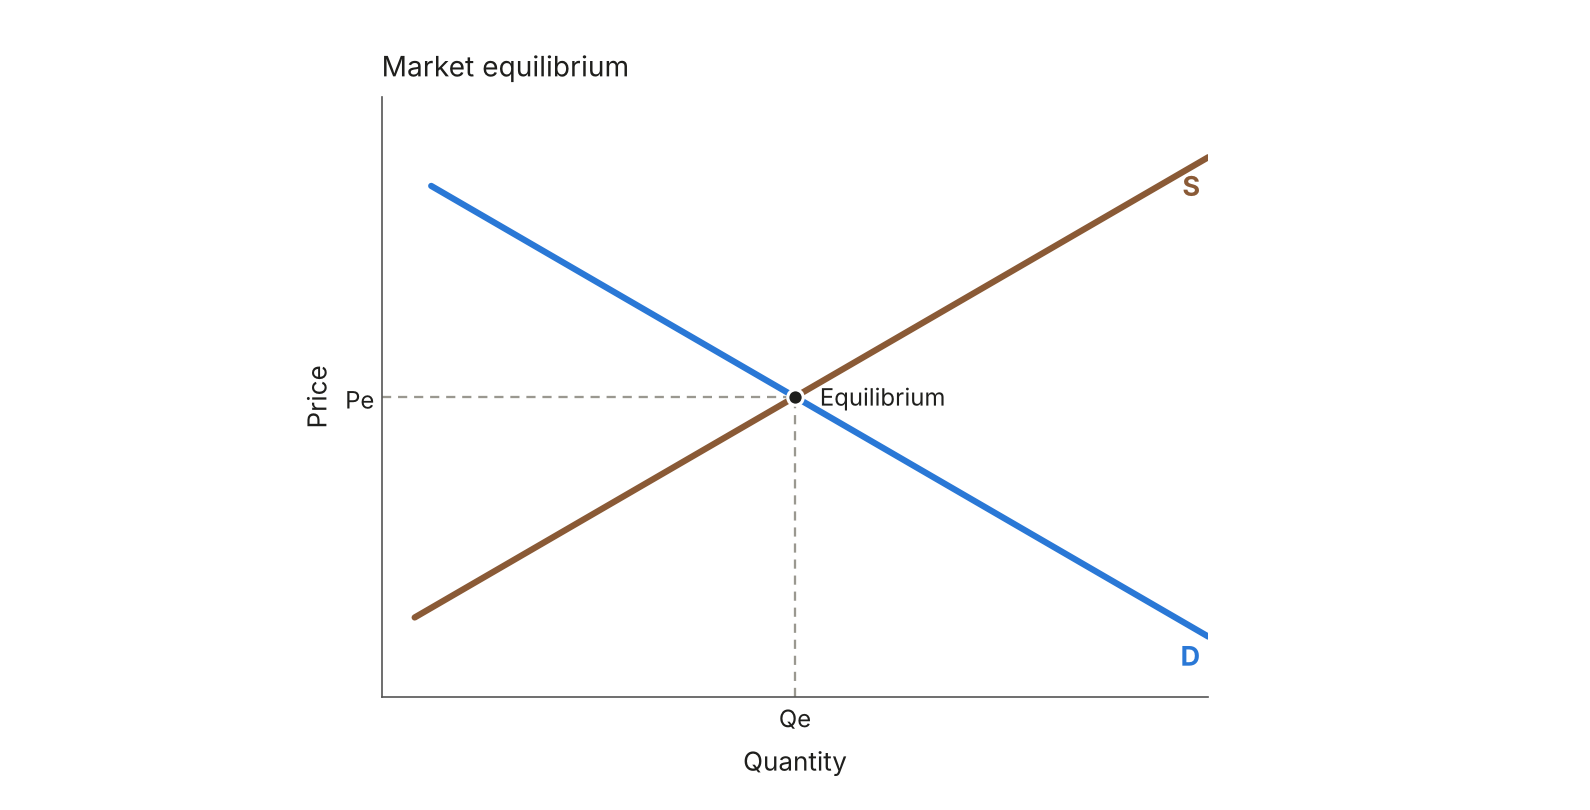
At the equilibrium price, producers sell everything they want to sell, and every consumer who wants to buy at that price can do so. Nothing is left unsold and there is no shortage, so it is also called the market clearing price. At any other price, the two quantities differ, so there is no equilibrium.
Example: the market for pizza slices
A food market has these daily figures for pizza slices:
- At $2: 900 slices demanded and 450 supplied.
- At $3: 600 slices demanded and 600 supplied.
- At $4: 400 slices demanded and 750 supplied.
Only at $3 are the two quantities equal, so the equilibrium price is $3 and the equilibrium quantity is 600 slices a day.
Shifts in demand and supply
When the demand or supply curve shifts, the market moves to a new equilibrium, with a new price and a new quantity.
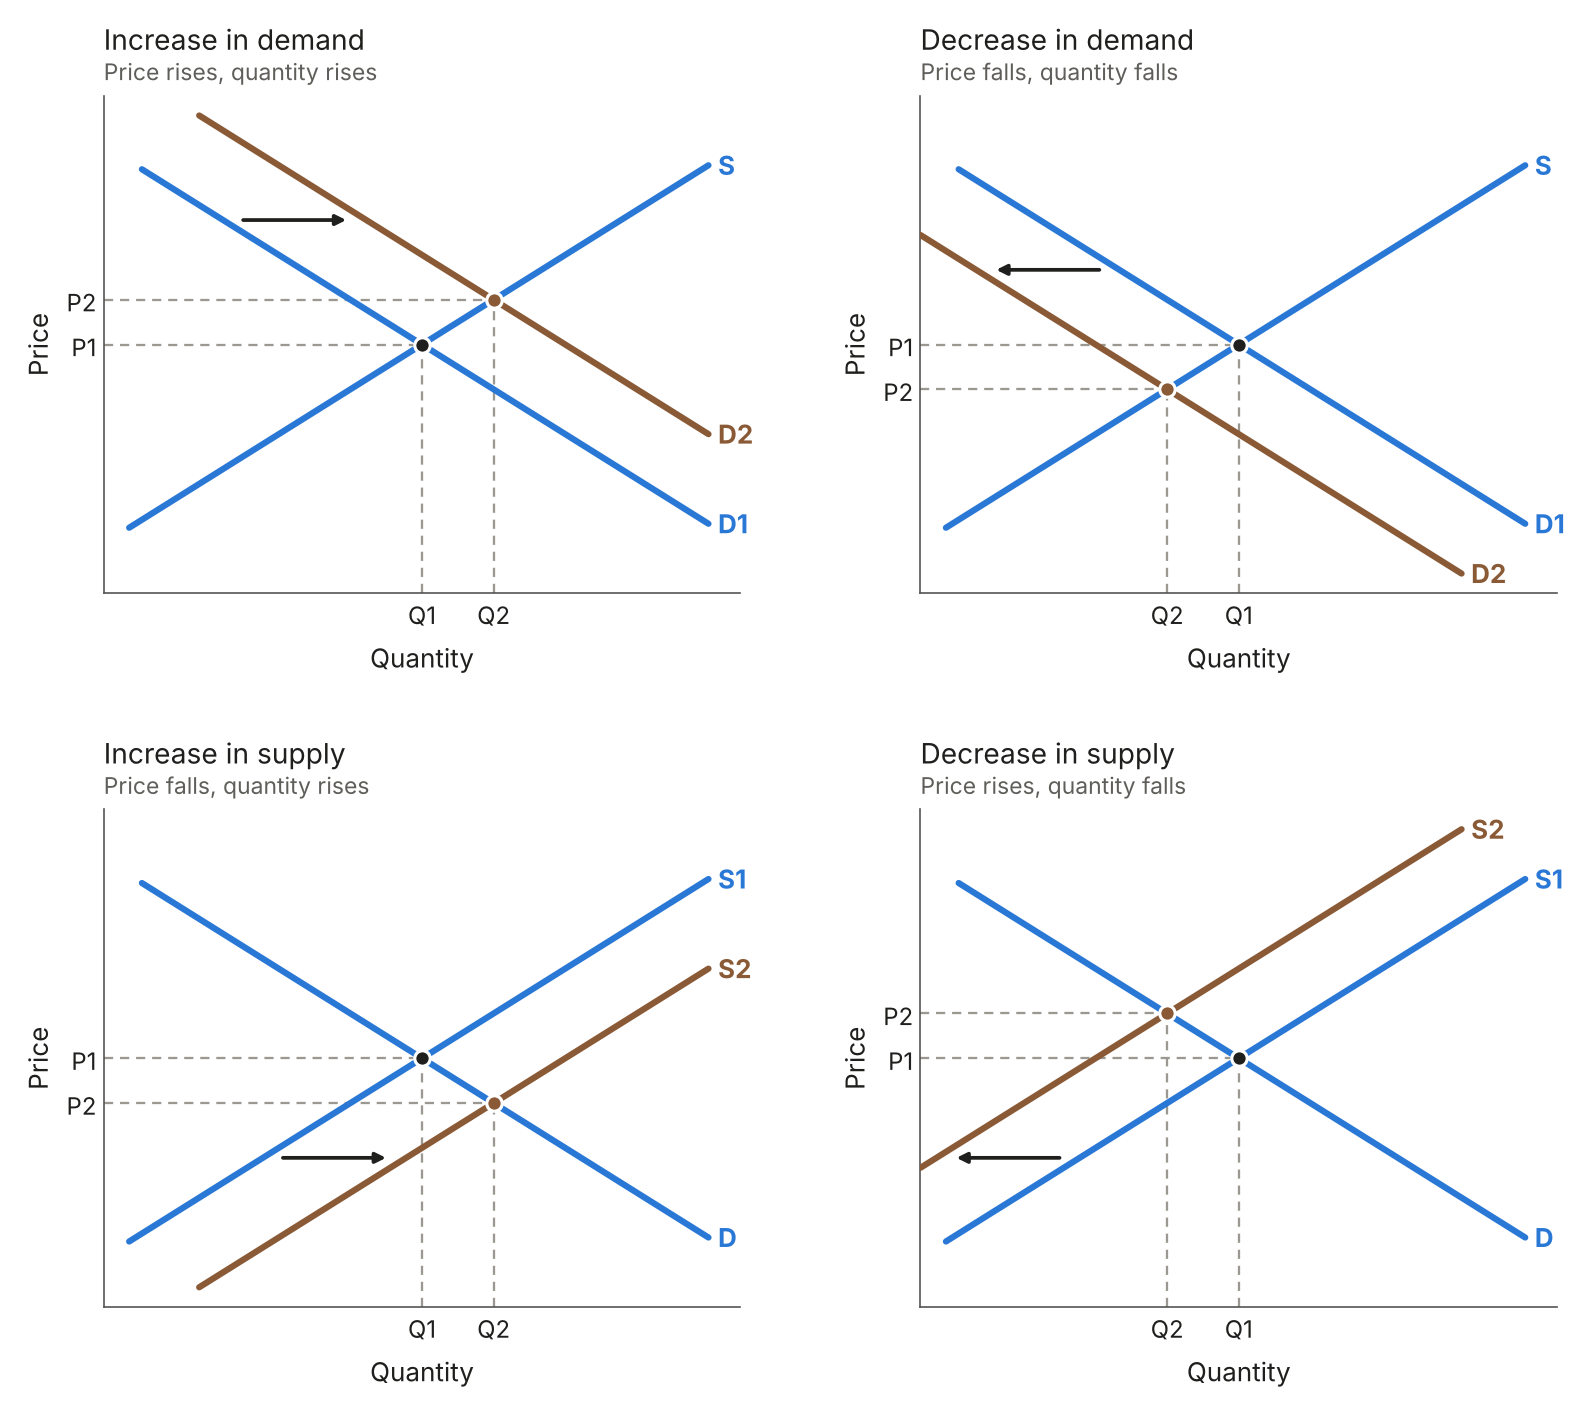
The four possible shifts:
- Increase in demand: demand moves right. Price and quantity both rise.
- Decrease in demand: demand moves left. Price and quantity both fall.
- Increase in supply: supply moves right. Price falls and quantity rises.
- Decrease in supply: supply moves left. Price rises and quantity falls.
For example, when demand increases, there is a shortage at the old price P1, so producers can charge more. The higher price encourages producers to supply more, until a new equilibrium is reached at P2 and Q2.
Sometimes demand and supply both change at once, e.g. demand rises while supply falls. The price will rise, but quantity could go up or down, depending on which shift is bigger.
Drawing a shift diagram
What a shift diagram needs:
- Both axes labelled, price and quantity
- The original demand and supply curves, with the original equilibrium marked (P1 and Q1)
- Only the curve affected by the change shifted, in the right direction, e.g. a subsidy moves supply, not demand
- The new curve labelled, e.g. D2 or S2
- The new price and quantity (P2 and Q2) marked on the axes
Example: two events in the market for rice
- The population grows: more people need feeding, so the demand for rice shifts to the right. The price of rice rises and more rice is bought and sold.
- Floods damage rice farms: the supply of rice shifts to the left. The price rises again, but less rice is bought and sold.
Excess demand and excess supply
Excess demand: where demand is greater than supply and there are shortages in the market.
Excess supply: where supply is greater than demand and there are unsold products in the market.
When each one happens:
- Price below equilibrium: consumers want to buy more than producers want to sell, so there is excess demand. Goods sell out and some buyers go without.
- Price above equilibrium: producers want to sell more than consumers want to buy, so there is excess supply. Goods are left unsold.
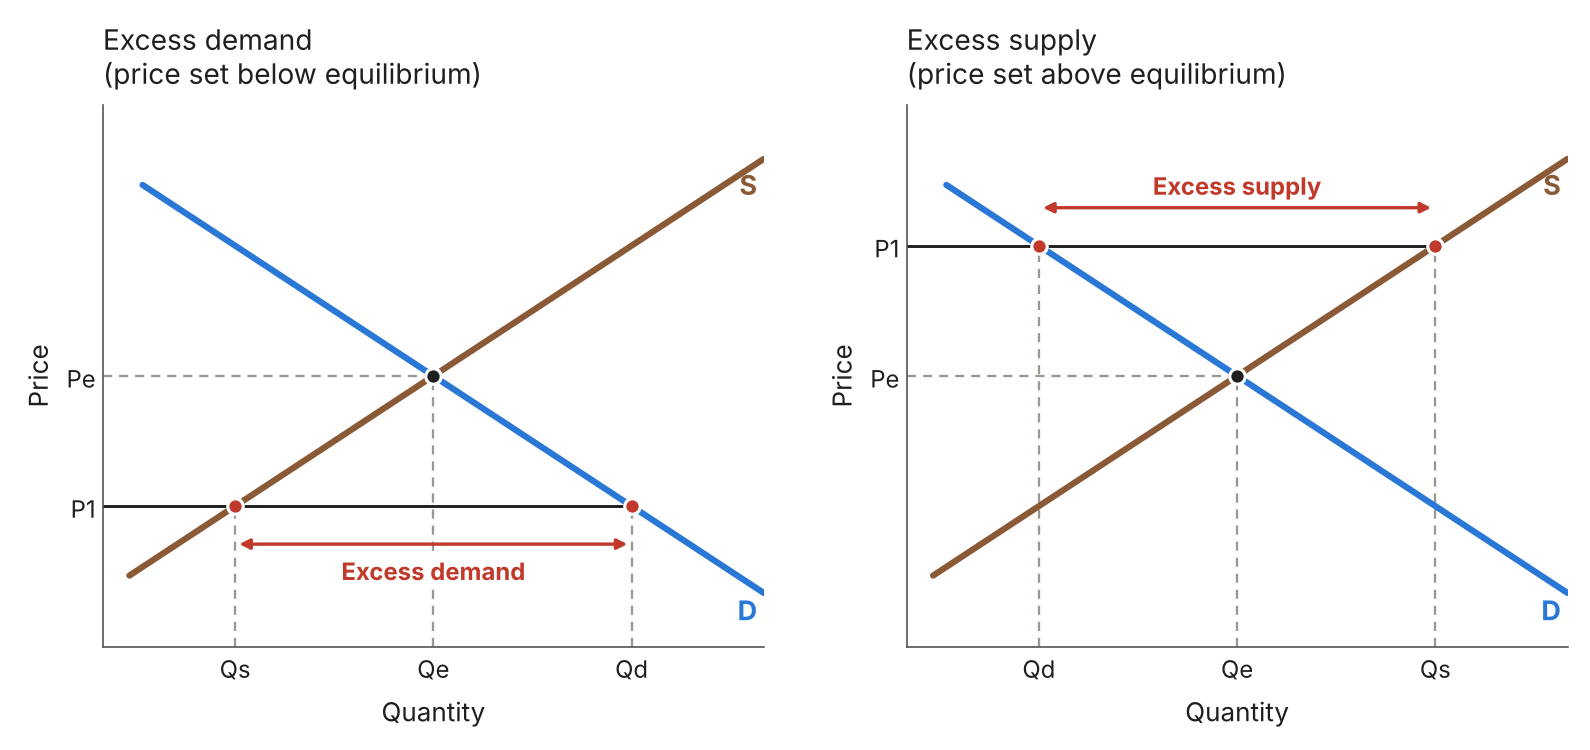
To show either one on a diagram, draw a line across at the price, P1. Read off the quantity demanded (Qd) from the demand curve and the quantity supplied (Qs) from the supply curve. The gap between Qd and Qs is the excess demand or excess supply.
Calculating excess demand and excess supply
The two calculations:
- Excess demand: quantity demanded – quantity supplied.
- Excess supply: quantity supplied – quantity demanded.
Example: pizza slices at $2 and $4
Using the pizza slice figures above:
- At $2: excess demand = 900 – 450 = 450 slices a day.
- At $4: excess supply = 750 – 400 = 350 slices a day.
Example: festival tickets over three days
A music festival sells 2 500 tickets a day, so 7 500 tickets over three days. The number of tickets demanded was 2 800 on Friday, 3 500 on Saturday and 2 700 on Sunday.
- Total demanded: 2 800 + 3 500 + 2 700 = 9 000 tickets.
- Excess demand: 9 000 – 7 500 = 1 500 tickets.
Working it out day by day gives the same answer: 300 + 1 000 + 200 = 1 500 tickets.
How market forces remove excess demand and excess supply
Market forces: supply and demand, as well as how they determine the allocation of scarce resources and price.
When a market is left to itself, the price changes until the excess disappears and the market is back in equilibrium.
Removing excess demand
When demand is greater than supply, there are more buyers than goods, so producers can raise the price.
As the price rises:
- The quantity demanded falls, as some buyers are put off
- The quantity supplied rises, as producers are willing to sell more at a higher price
The price keeps rising until the two quantities are equal at the equilibrium price. Producers could also remove a shortage by using more resources to increase supply.
Removing excess supply
When supply is greater than demand, producers are left with unsold stock, so they lower the price.
As the price falls:
- The quantity demanded rises, as more consumers are willing to buy
- The quantity supplied falls, as producers are less willing to sell at a lower price
The price keeps falling until the market clears at the equilibrium price. Producers could instead store the extra goods and sell them later, but storage costs money and does not work for goods that go off quickly, such as fresh food.
Example: removing excess demand
A bakery sells a new croissant for $2. It bakes 200 a day, but 350 customers want one, so there is excess demand of 150 croissants and they sell out by 9 am. The bakery raises the price to $3. Some customers now choose something else, and the higher price makes it worth baking more. At $3, 260 croissants are demanded and 260 are baked, so the shortage has gone.
Example: removing excess supply
At a town market, watermelons sell for $4 each. Farmers bring 1 200, but shoppers only want 700, leaving excess supply of 500. Watermelons do not keep for long, so the farmers cannot store them. They cut the price to $3. Shoppers buy more, and some farmers bring fewer to the market. At $3, 1 000 are demanded and 1 000 are supplied, so none are left unsold.

