Microeconomics
1.1.4 Elasticity
The market system
Price elasticity of demand (PED)
Price elasticity of demand (PED): measures the responsiveness of demand to a change in price.
When a price changes, the quantity demanded usually changes in the opposite direction. PED shows by how much. For some products, a small price change makes people buy a lot more or a lot less. For others, people keep buying roughly the same amount.
Calculating PED
Formula:
PED = % change in quantity demanded ÷ % change in price
Rules for the answer:
- Keep the minus sign: price and quantity demanded change in opposite directions, so PED is negative. Show the minus sign in the working and in the answer.
- No units: PED is just a number, so do not write % or $ after it.
- Rounding: answers are usually given to two decimal places.
Example: two PED calculations
- Phone cases: a seller cuts the price by 3%, and the quantity demanded rises by 7%. PED = 7% ÷ –3% = –2.33 (to two decimal places).
- Monthly bus pass: the price rises by 10%, and the quantity demanded falls by 3%. PED = –3% ÷ 10% = –0.30.
The formula can also be rearranged to find the change in quantity demanded: % change in quantity demanded = PED × % change in price.
Example: The PED for cinema tickets is –0.4 and the price rises by 15%. The change in quantity demanded = –0.4 × 15% = –6%, so 6% fewer tickets are sold.
Interpreting PED values
Ignore the minus sign when deciding whether a value is above or below 1.
The five types of PED:
- Perfectly price inelastic (PED = 0): a change in price has no effect on the quantity demanded.
- Price inelastic (between 0 and –1): the % change in quantity demanded is smaller than the % change in price, e.g. –0.30.
- Unitary price elasticity (PED = –1): the % change in quantity demanded is exactly the same as the % change in price.
- Price elastic (more than 1, ignoring the sign): the % change in quantity demanded is bigger than the % change in price, e.g. –2.33.
- Perfectly price elastic (PED = infinity): if the price rises at all, the quantity demanded falls to zero.
Example: which products are price elastic?
- Product W, PED –1.5: price elastic.
- Product X, PED –1: unitary price elasticity.
- Product Y, PED –0.5: price inelastic.
- Product Z, PED 0: perfectly price inelastic.
Diagrams for price elastic and price inelastic demand
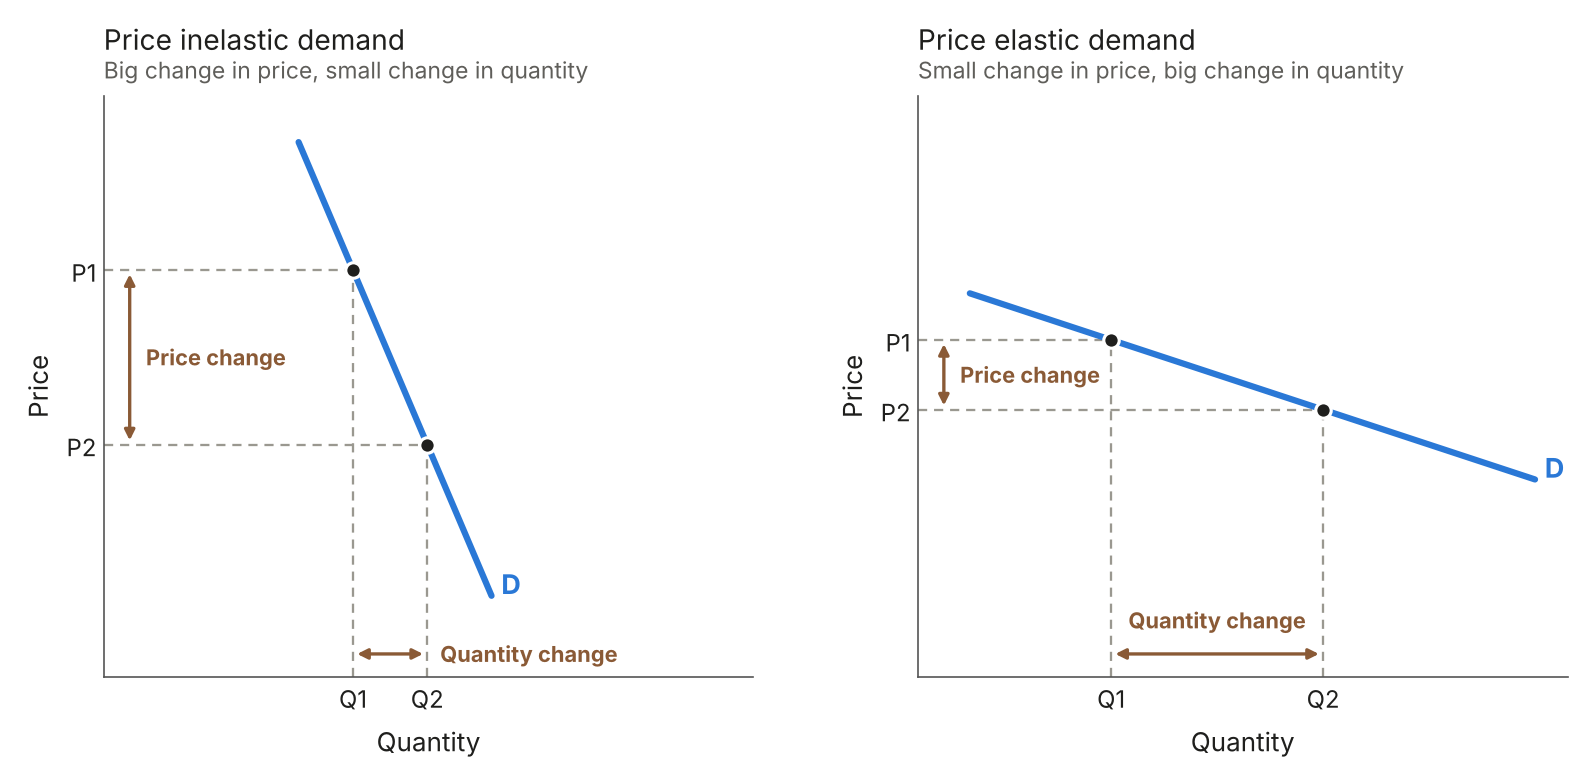
What the two diagrams show:
- Price inelastic demand: a steep demand curve. A big change in price, from P1 to P2, causes only a small change in quantity, from Q1 to Q2.
- Price elastic demand: a flat demand curve. A small change in price causes a big change in quantity.
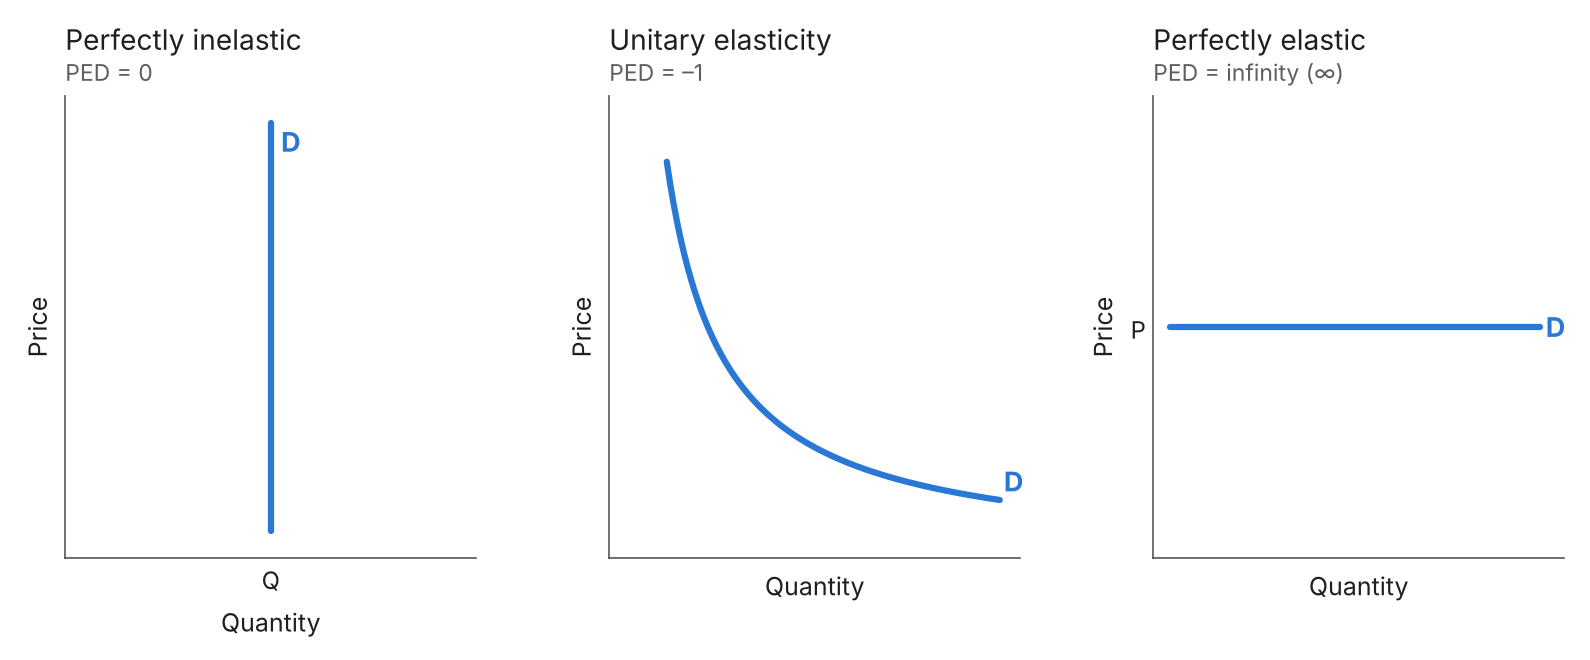
Three special cases:
- Perfectly inelastic demand: a vertical demand curve. The quantity stays at Q whatever the price.
- Unitary elasticity: a curved demand curve. Total revenue is the same at every price along it.
- Perfectly elastic demand: a horizontal demand curve at price P. Above P, nothing is bought.
Drawing a price elastic or price inelastic demand curve
What the diagram needs:
- The demand curve labelled D
- A flat curve for elastic demand, or a steep curve for inelastic demand
- The price change marked on the price axis, from P1 to P2
- The quantity change marked on the quantity axis, from Q1 to Q2
- For elastic demand, a smaller change in price than in quantity, and the reverse for inelastic demand
Factors influencing PED
Four factors that affect PED:
- Substitutes: if a product has many close substitutes, consumers can easily switch when its price rises, so demand is price elastic. With few or no substitutes, demand is price inelastic.
- Degree of necessity: people keep buying essentials, like food and fuel, even when prices rise, so demand is price inelastic. Non-essential products, such as holidays, have more elastic demand. A habit-forming product can become a necessity for the people who buy it, so its demand is inelastic.
- Percentage of income spent on the good or service: if a product takes up a large share of income, e.g. a television, a price rise has a big effect, so demand is more elastic. If it costs very little compared with income, e.g. a pencil, demand is more inelastic.
- Time: in the short term, demand tends to be inelastic, as consumers need time to find alternatives or break a habit. Over a longer period, demand becomes more elastic as they find substitutes and switch.
Example: Visitors to a theme park cannot leave to buy a drink elsewhere, so the park’s café has few substitutes. A coffee is also a small share of most visitors’ income. Demand for its coffee is probably price inelastic, so the café can charge more than cafés outside the park without losing many customers.
PED and total revenue
Total revenue: The amount of money gained from the sale of all products.
Formula:
Total revenue = Price × Quantity sold
When a business changes its price, the quantity demanded changes too, so total revenue changes. What happens to total revenue depends on PED.
How a price change affects total revenue:
- Price inelastic demand: a price rise increases total revenue, and a price cut reduces it. The quantity demanded changes by a smaller % than the price.
- Price elastic demand: a price rise reduces total revenue, and a price cut increases it. The quantity demanded changes by a bigger % than the price.
- Unitary price elasticity: total revenue stays the same.
This works the other way too. Calculate total revenue before and after a price change. If price and total revenue move in the same direction, demand is price inelastic. If they move in opposite directions, demand is price elastic.
Example: a cinema raises its price
- Before: $10 × 1 000 tickets a week = $10 000.
- After: $12 × 900 tickets a week = $10 800.
The price rose and total revenue rose by $800, so demand is price inelastic.
Example: a juice bar cuts its price
- Before: $5 × 200 smoothies a day = $1 000.
- After: $4 × 300 smoothies a day = $1 200.
The price fell but total revenue rose by $200, so demand is price elastic.
Price elasticity of supply (PES)
Price elasticity of supply (PES): measures the responsiveness of supply to a change in price.
When the price rises, firms want to supply more. PES shows how easily and quickly they can do so.
Calculating PES
Formula:
PES = % change in quantity supplied ÷ % change in price
Price and quantity supplied move in the same direction, so PES is positive. As with PED, write no units after the answer.
Example: two PES calculations
- Handmade furniture: the price rises by 10%, and the quantity supplied rises by 4%. PES = 4% ÷ 10% = 0.40.
- T-shirts: the price rises by 5%, and the quantity supplied rises by 9%. PES = 9% ÷ 5% = 1.80.
Rearranged, % change in quantity supplied = PES × % change in price. For example, if PES is 1.2 and the price rises by 10%, the quantity supplied rises by 1.2 × 10% = 12%.
Interpreting PES values
The five types of PES:
- Perfectly price inelastic (PES = 0): the quantity supplied cannot change, whatever the price.
- Price inelastic (between 0 and 1): the % change in quantity supplied is smaller than the % change in price, e.g. 0.40.
- Unitary price elasticity (PES = 1): the % change in quantity supplied is exactly the same as the % change in price.
- Price elastic (greater than 1): the % change in quantity supplied is bigger than the % change in price, e.g. 1.80.
- Perfectly price elastic (PES = infinity): producers will supply any amount at the given price.
Diagrams for price elastic and price inelastic supply
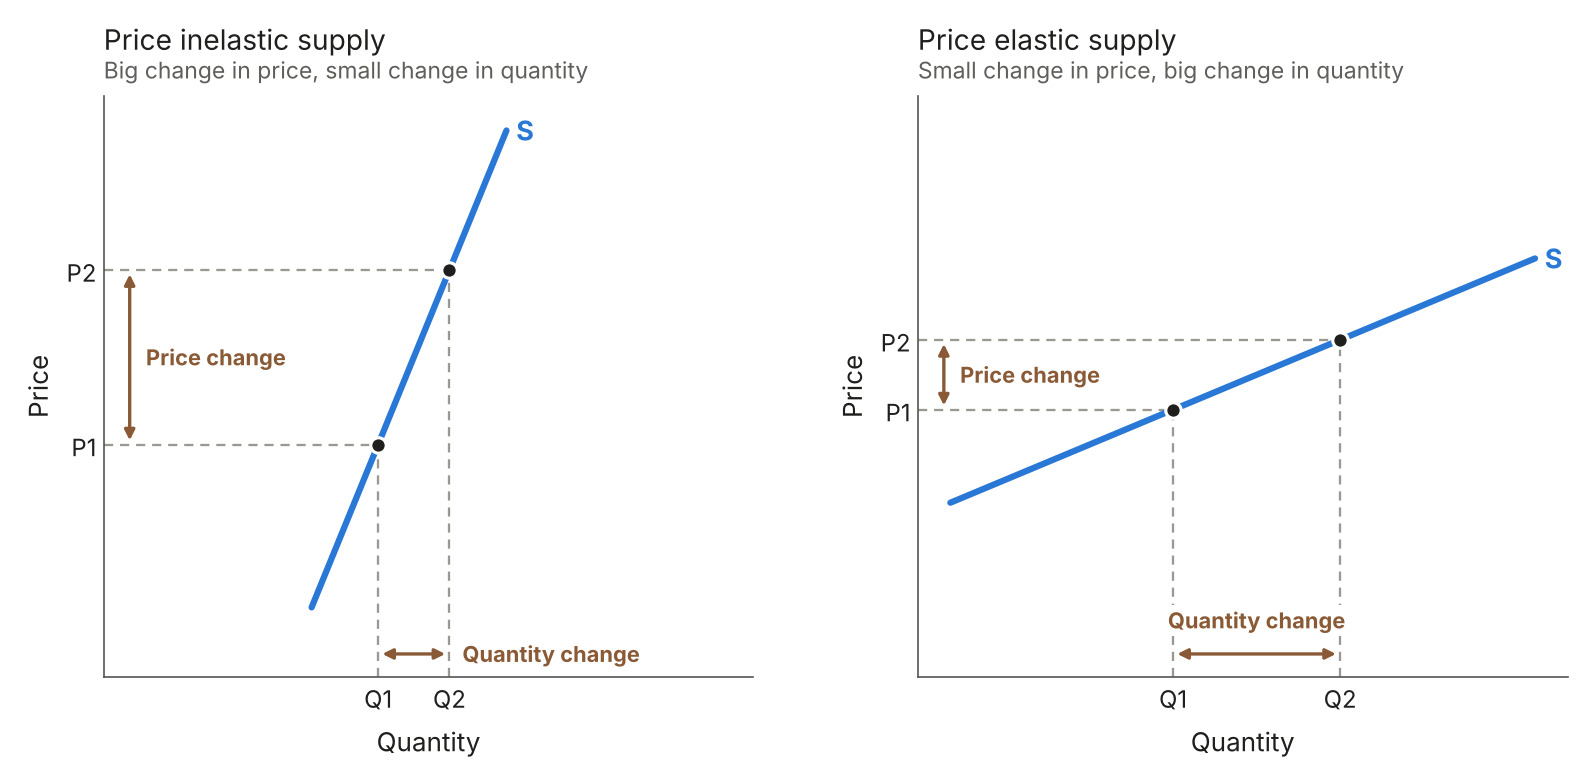
What the two diagrams show:
- Price inelastic supply: a steep supply curve. A big change in price causes only a small change in quantity supplied. A straight supply curve that would meet the quantity axis is inelastic.
- Price elastic supply: a flat supply curve. A small change in price causes a big change in quantity supplied. A straight supply curve that would meet the price axis is elastic.
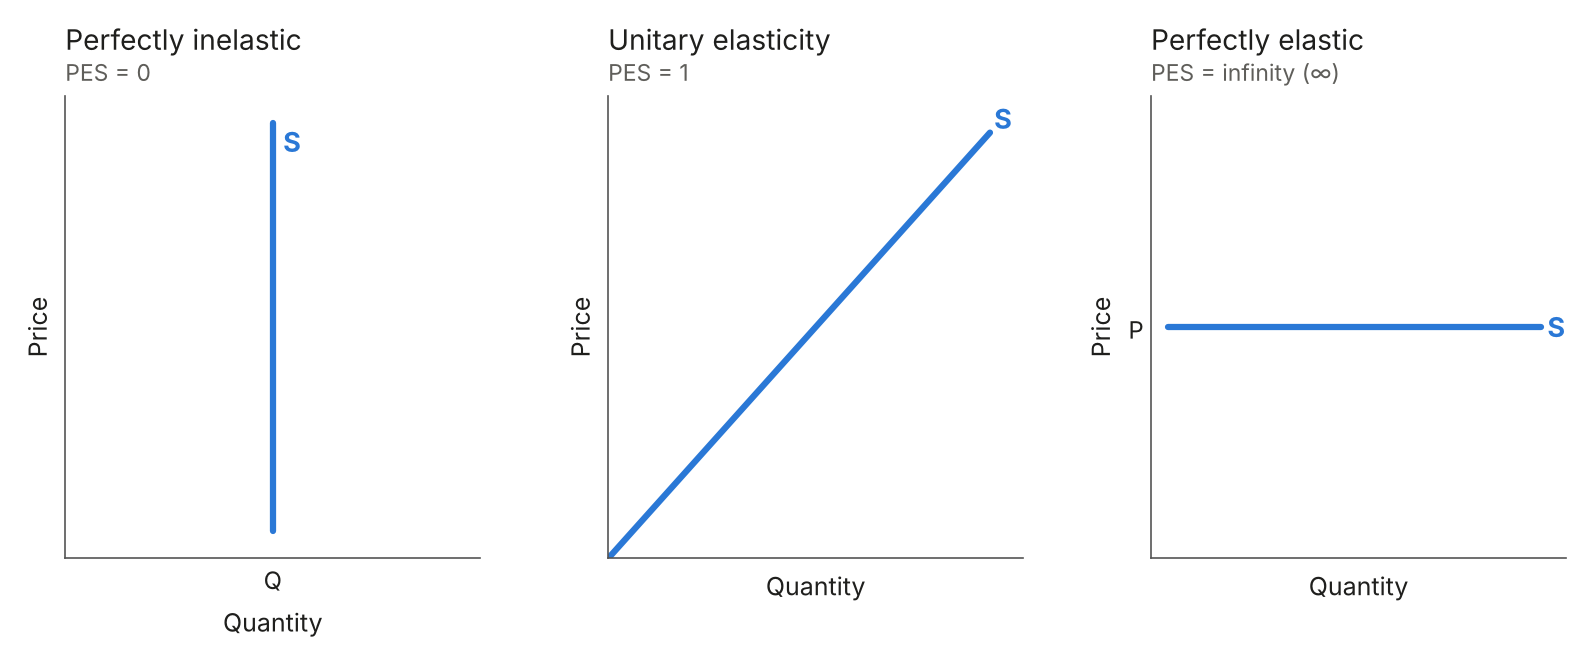
Three special cases:
- Perfectly inelastic supply: a vertical supply curve, e.g. the seats in a stadium.
- Unitary elasticity: any straight supply curve starting from the origin (0, 0).
- Perfectly elastic supply: a horizontal supply curve.
As with demand, a PES diagram should show the curve labelled S, with the price change from P1 to P2 and the quantity change from Q1 to Q2 marked on the axes.
Factors influencing PES
Supply is elastic when producers can raise output easily. Anything that makes this hard makes supply more inelastic.
Four factors that affect PES:
- Factors of production: if firms can easily get more labour, raw materials, energy and machinery, supply is elastic. If they need specialised resources, such as highly skilled workers who take time to train, supply is more inelastic.
- Availability of stocks: firms that keep stocks can sell more as soon as the price rises, so supply is elastic. If goods cannot be stored, e.g. fresh fruit, supply is inelastic.
- Spare capacity: a firm with unused machines or factory space can produce more quickly, so supply is elastic. A firm already at full capacity cannot, so supply is inelastic.
- Time: given enough time, most producers can increase output, e.g. by building a bigger factory. So supply becomes more elastic over a longer period.
PES for manufactured and primary products
- Manufactured products are usually price elastic: factories can raise output quickly by running extra shifts or asking staff to work overtime, as long as they have spare capacity. Many manufactured goods, e.g. cars or textiles, can be stored, and production does not depend on the weather.
- Primary products are usually price inelastic: crops take time to grow, so farmers often cannot supply more until the next harvest. Output depends on the weather, and many crops are perishable, so they cannot be stored. Minerals such as gold and diamonds also have inelastic supply, as there are few sources and mining them is costly and slow.
A manufacturer that is already working at full capacity may also find it hard to raise supply quickly, so its supply can be inelastic too.
Example: T-shirts and mangoes
- A T-shirt factory: when the price of T-shirts rises, it adds a night shift and sells stock from its warehouse, so supply rises quickly. Supply is price elastic.
- Mango farmers: when the price of mangoes rises, they cannot grow more until the next harvest, and mangoes go off quickly, so they have no stock to sell. Supply barely changes this season, so it is price inelastic.
Income elasticity of demand
Income elasticity of demand (YED): measures the responsiveness of quantity demanded to a change in income.
Calculating YED
Formula:
YED = % change in quantity demanded ÷ % change in income
YED can be positive or negative, so always show the sign.
Example: incomes rise by 4%
- Meals out at restaurants: the quantity demanded rises by 10%. YED = 10% ÷ 4% = 2.50.
- Milk: the quantity demanded rises by 1%. YED = 1% ÷ 4% = 0.25.
- Bus journeys: the quantity demanded falls by 2%. YED = –2% ÷ 4% = –0.50.
Interpreting YED values
Normal good: Goods for which demand will increase as incomes increase.
Inferior good: Goods for which demand will decrease as incomes increase.
Luxury good: A good for which income elasticity of demand is greater than 1, where the proportionate change in demand is greater than the proportionate change in income.
What each YED value shows:
- Luxury good (YED greater than 1): demand rises by a bigger % than income, e.g. meals out at restaurants (2.50).
- Normal good (YED positive): demand rises as income rises, e.g. milk (0.25).
- Inferior good (YED negative): demand falls as income rises, e.g. bus journeys (–0.50).
A luxury good is also a normal good, since its YED is positive. What makes it a luxury is that its YED is greater than 1. A YED of 0.7 shows a normal good, but not a luxury.
Why PED and YED matter to businesses and the government
Indirect taxes and subsidies
- Government, raising tax revenue: governments tend to put indirect taxes on goods with price inelastic demand, such as alcohol, petrol and cigarettes. Consumers keep buying them after the price rises, so tax revenue is high. If demand is elastic, consumers avoid the taxed goods, so less revenue comes in.
- Government, reducing consumption: if a tax is meant to cut harmful consumption, e.g. of fuel that causes pollution, inelastic demand is a problem. People keep buying, so the tax does little to reduce consumption.
- Government, avoiding taxes on essentials: food and water have inelastic demand, but most governments avoid taxing goods that people need to survive.
- Government, giving subsidies: a subsidy shifts supply to the right. If the aim is to make a good cheaper for people on low incomes, demand needs to be price inelastic, otherwise the price only falls slightly. This is one reason why farmers are often given subsidies, as demand for many foods is inelastic.
- Businesses: when a tax pushes up the price of a product with inelastic demand, the business loses only a few sales, so its revenue does not fall much. If demand is elastic, sales and revenue fall by more.
Changes in income
- Planning output: firms selling luxury goods can expect demand to rise when incomes rise. They can make sure they have enough capacity. If a recession is coming and incomes are expected to fall, they may cut output.
- Inferior goods: firms selling inferior goods may expect more sales in a recession, as falling incomes push up demand for their products.
- Switching production: a firm with flexible resources can switch to products with a higher YED when incomes are expected to rise.
- Planning staff and costs: knowing YED helps a business plan how many workers it will need, so it avoids paying for staff it does not need.
Price changes
PED also helps businesses predict what a price change will do to total revenue. With inelastic demand, a price rise increases revenue. With elastic demand, a price cut increases revenue, e.g. rail companies offer cheap off-peak fares to attract more passengers.
Example: a coach company
- YED: the YED for coach travel is –1.5, so it is an inferior good. Incomes are forecast to fall next year, so the company adds more routes and hires extra drivers.
- PED: the PED for its weekend tickets is –0.6, so demand is price inelastic. Raising the price of weekend tickets should increase its total revenue.
- Indirect tax: the government raises the tax on fuel. Fuel costs rise, but demand for coach travel is inelastic, so the company can raise its fares without losing many passengers.

