Revision resources
Important diagrams
Every diagram in the specification, with tips on how to use them
All the diagrams in the specification, in specification order. Tap or click a diagram to open it full size. Each section also links to its full notes.
1.1 The market system
1.1.1 The economic problem
A production possibility curve: the most an economy can produce of two goods when it uses all its resources.
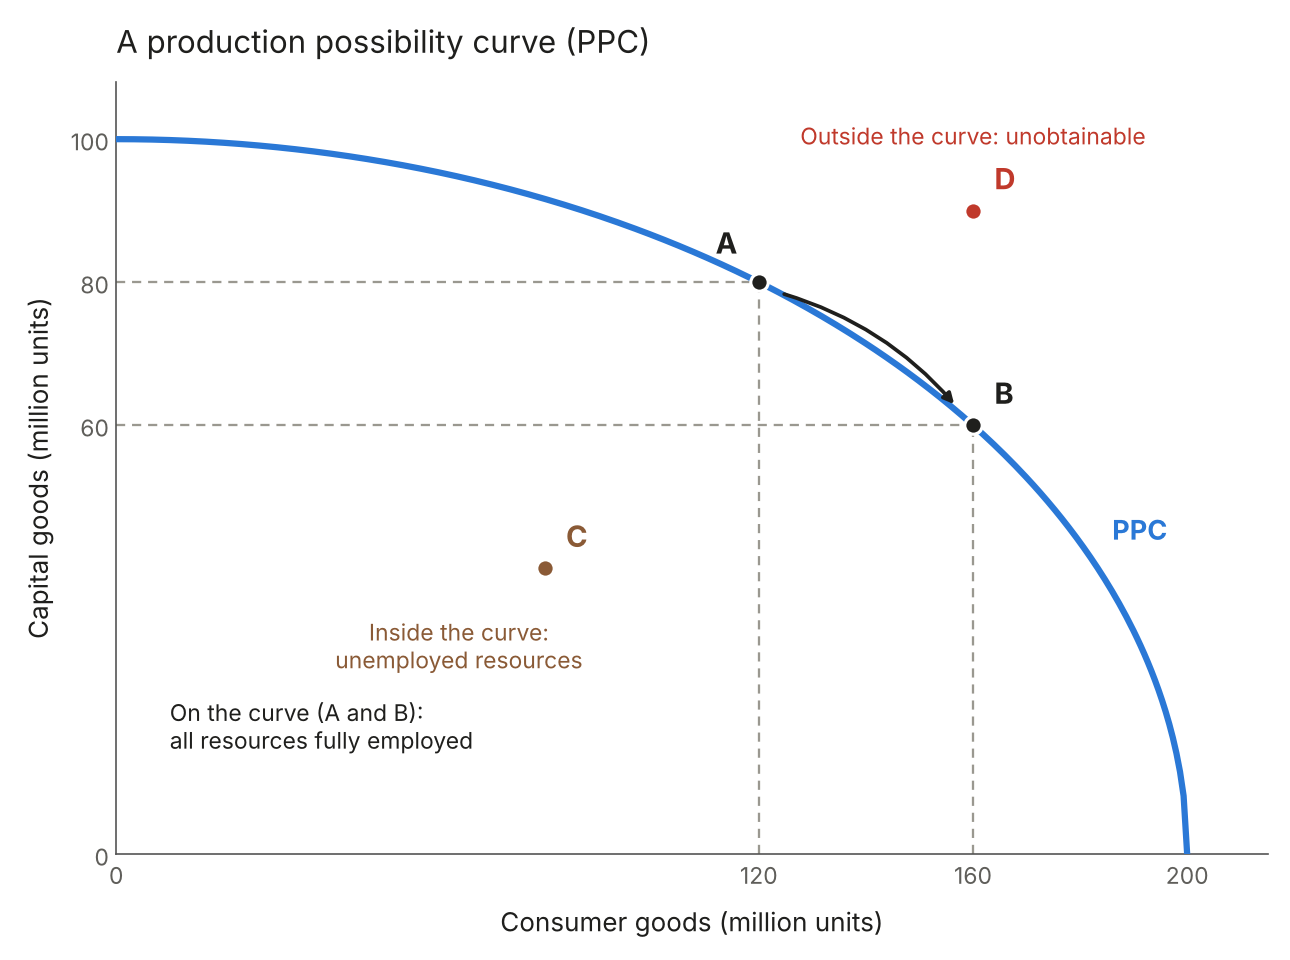
Figure 1: A production possibility curve (PPC)
Positive economic growth: the PPC shifts outwards, so more of both goods can be produced.
Negative economic growth: the PPC shifts inwards, so less of both goods can be produced.
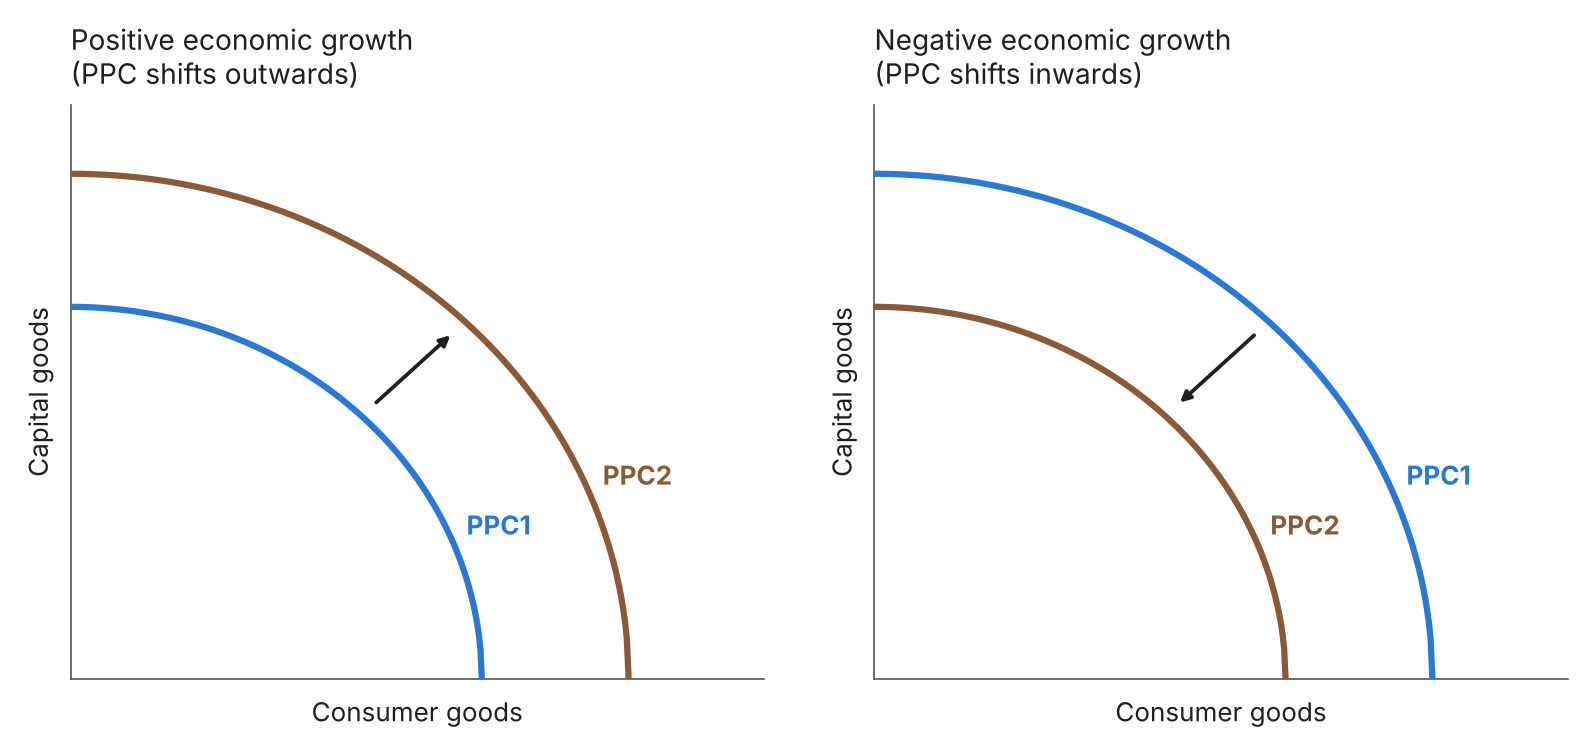
Figure 2: Shifts in the production possibility curve
1.1.3 Demand, supply and market equilibrium
Movement along the demand curve: caused by a change in the good’s own price.
Shifts in the demand curve: caused by a change in something other than price. D2 is an increase in demand and D3 is a decrease.
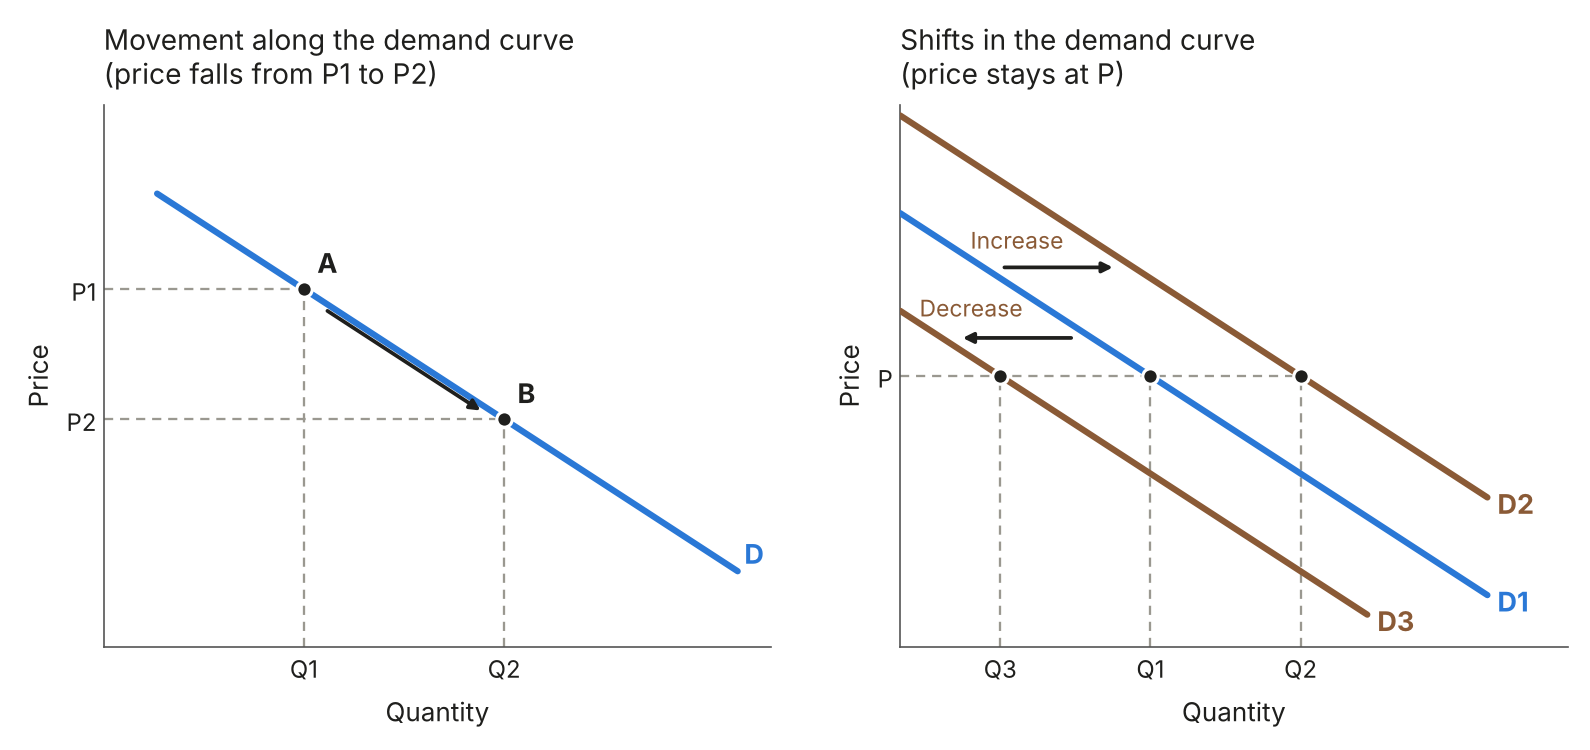
Figure 3: Movements along and shifts in the demand curve
Movement along the supply curve: caused by a change in the good’s own price.
Shifts in the supply curve: caused by anything other than a change in price. S2 is an increase in supply and S3 is a decrease.
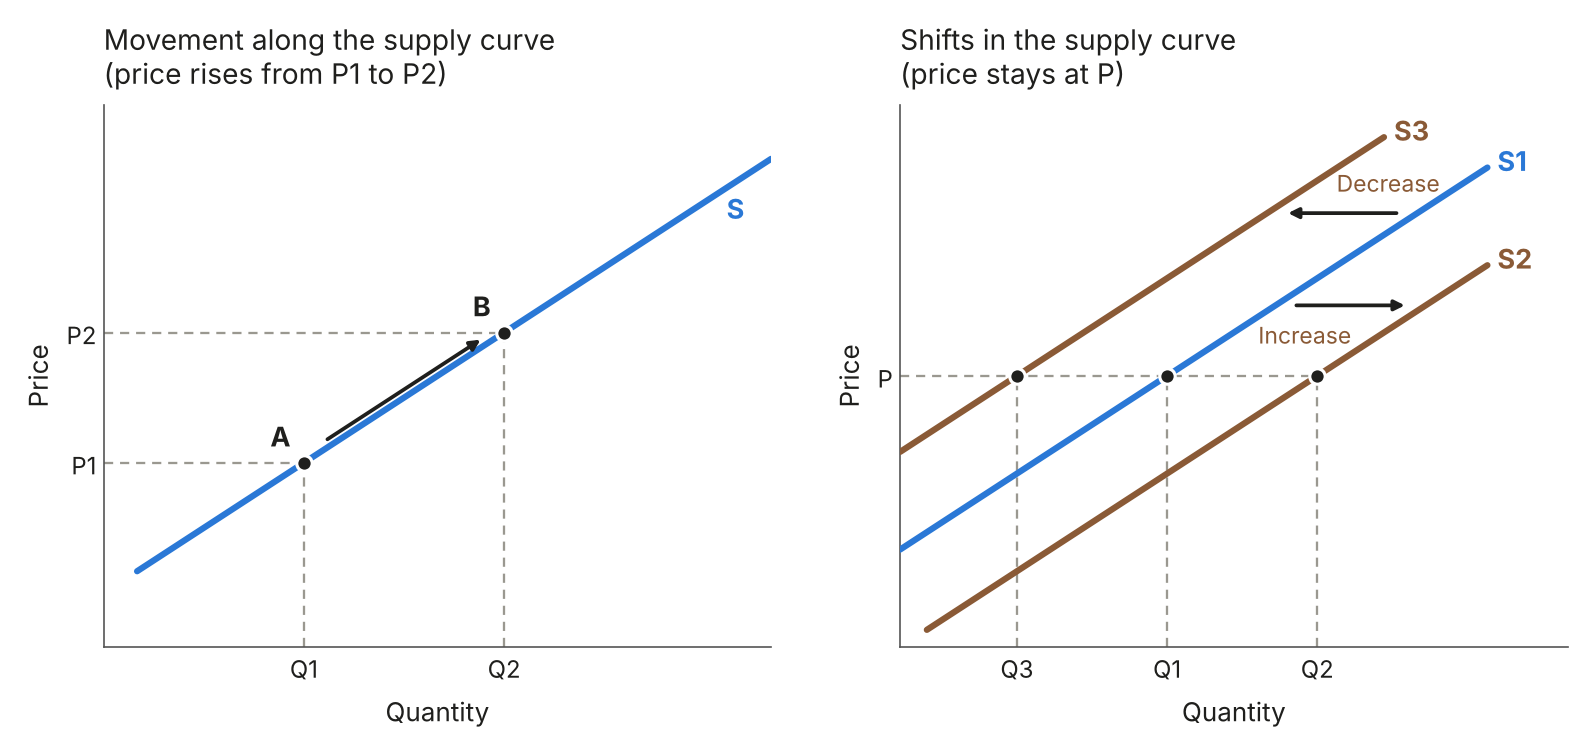
Figure 4: Movements along and shifts in the supply curve
Market equilibrium: the point where the demand and supply curves cross.
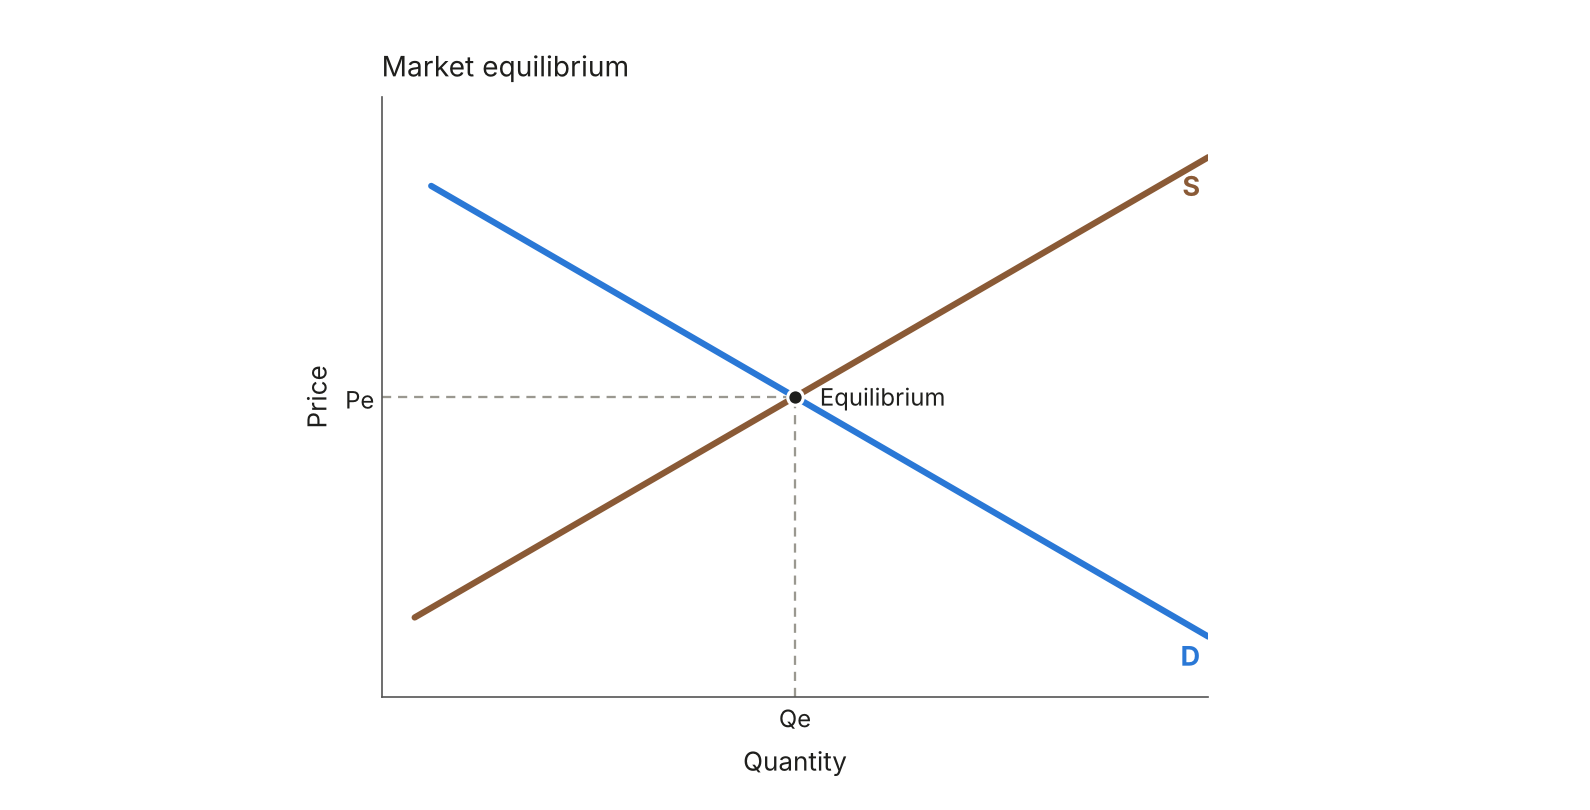
Figure 5: Market equilibrium
Plotting from data: the daily figures for pizza slices at $2, $3 and $4, plotted as points and joined up.
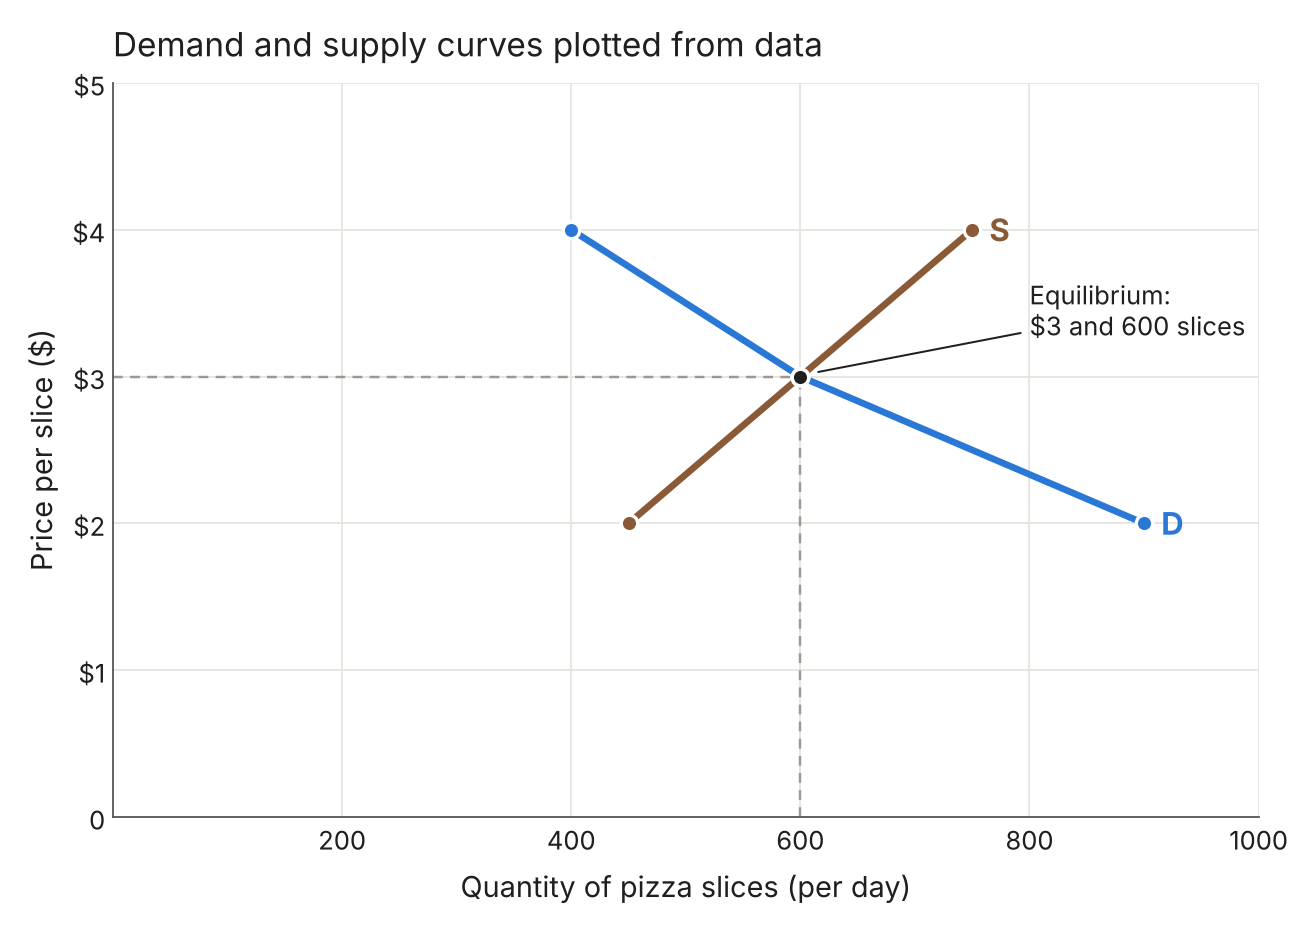
Figure 6: Demand and supply curves plotted from data
Increase in demand: price and quantity both rise.
Decrease in demand: price and quantity both fall.
Increase in supply: price falls and quantity rises.
Decrease in supply: price rises and quantity falls.
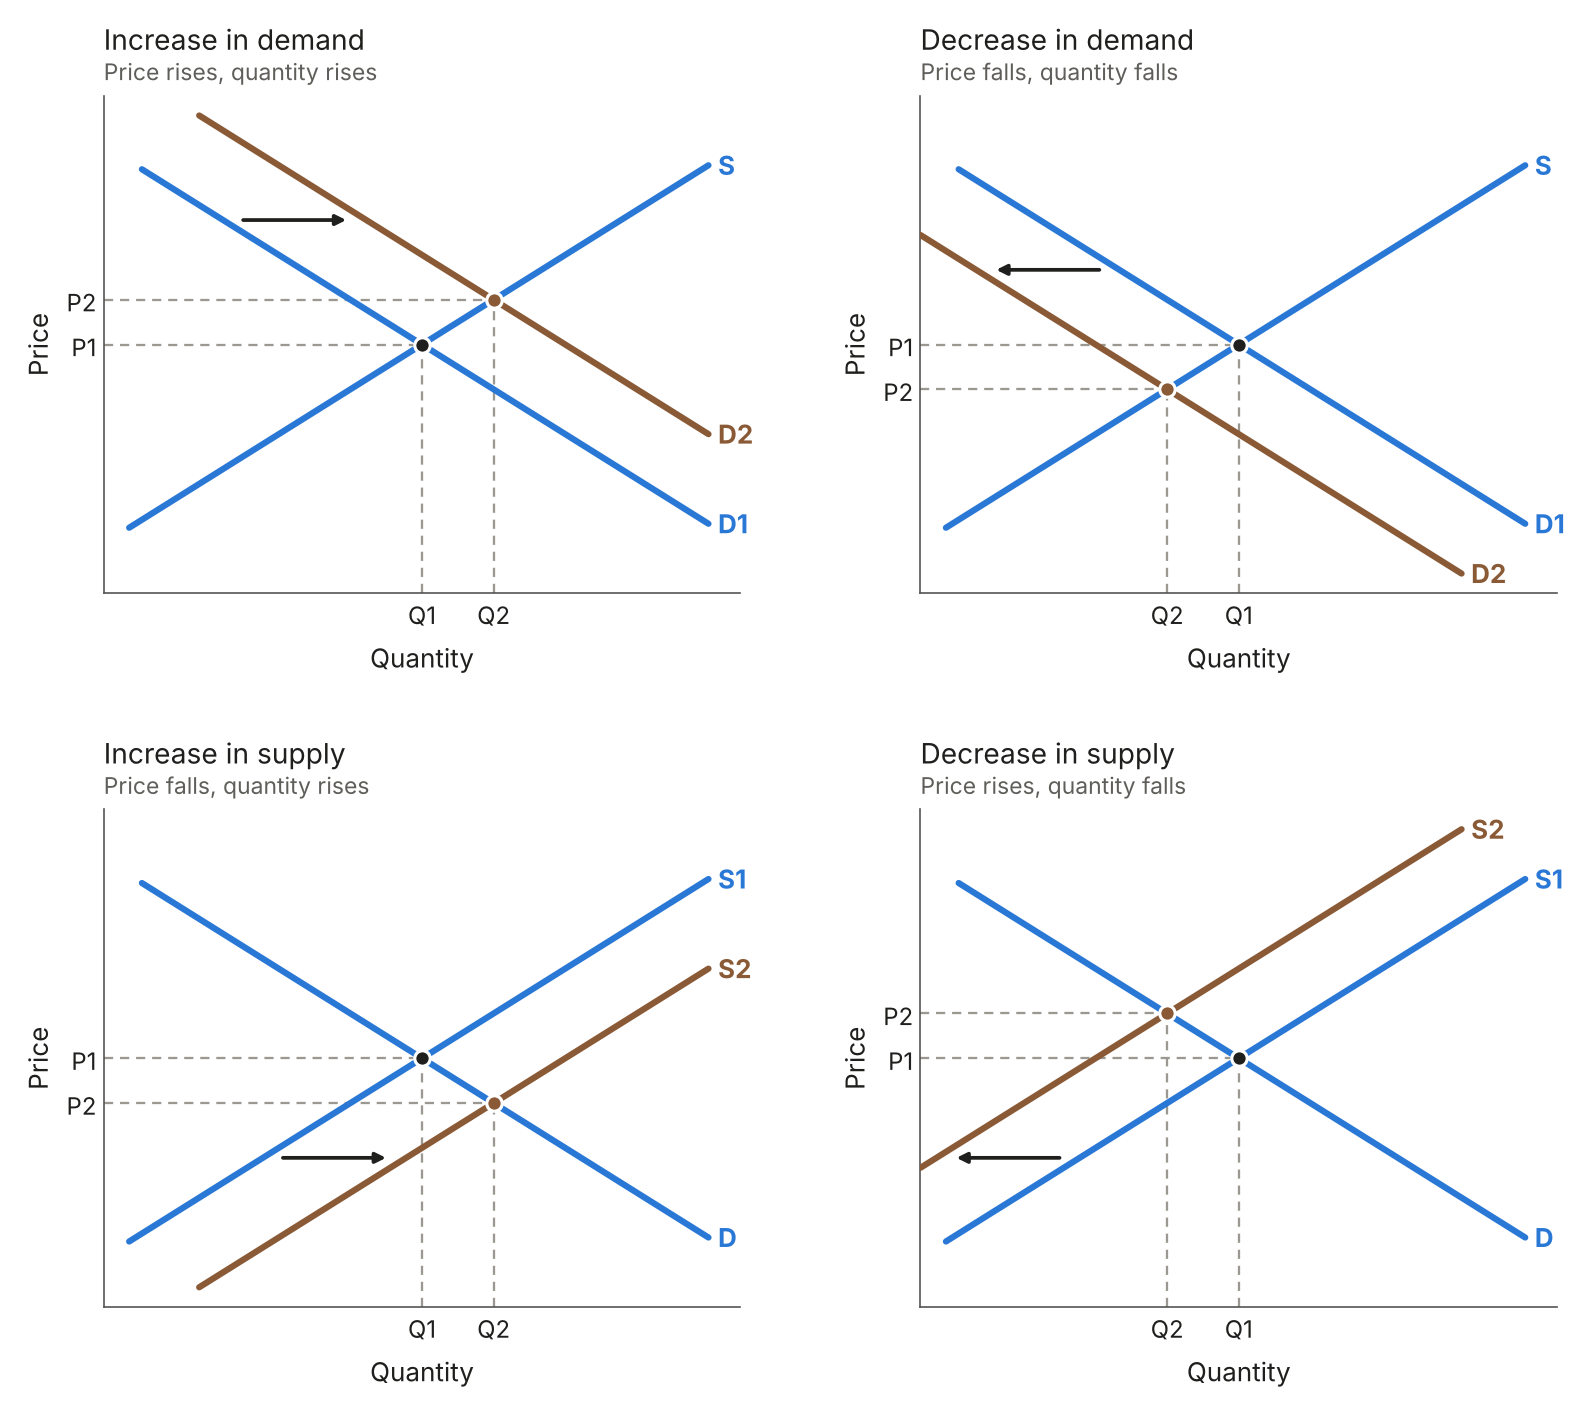
Figure 7: How shifts in demand and supply change the equilibrium
Excess demand: the price is set below equilibrium, so more is demanded than supplied: Qd is bigger than Qs.
Excess supply: the price is set above equilibrium, so Qs is greater than Qd.
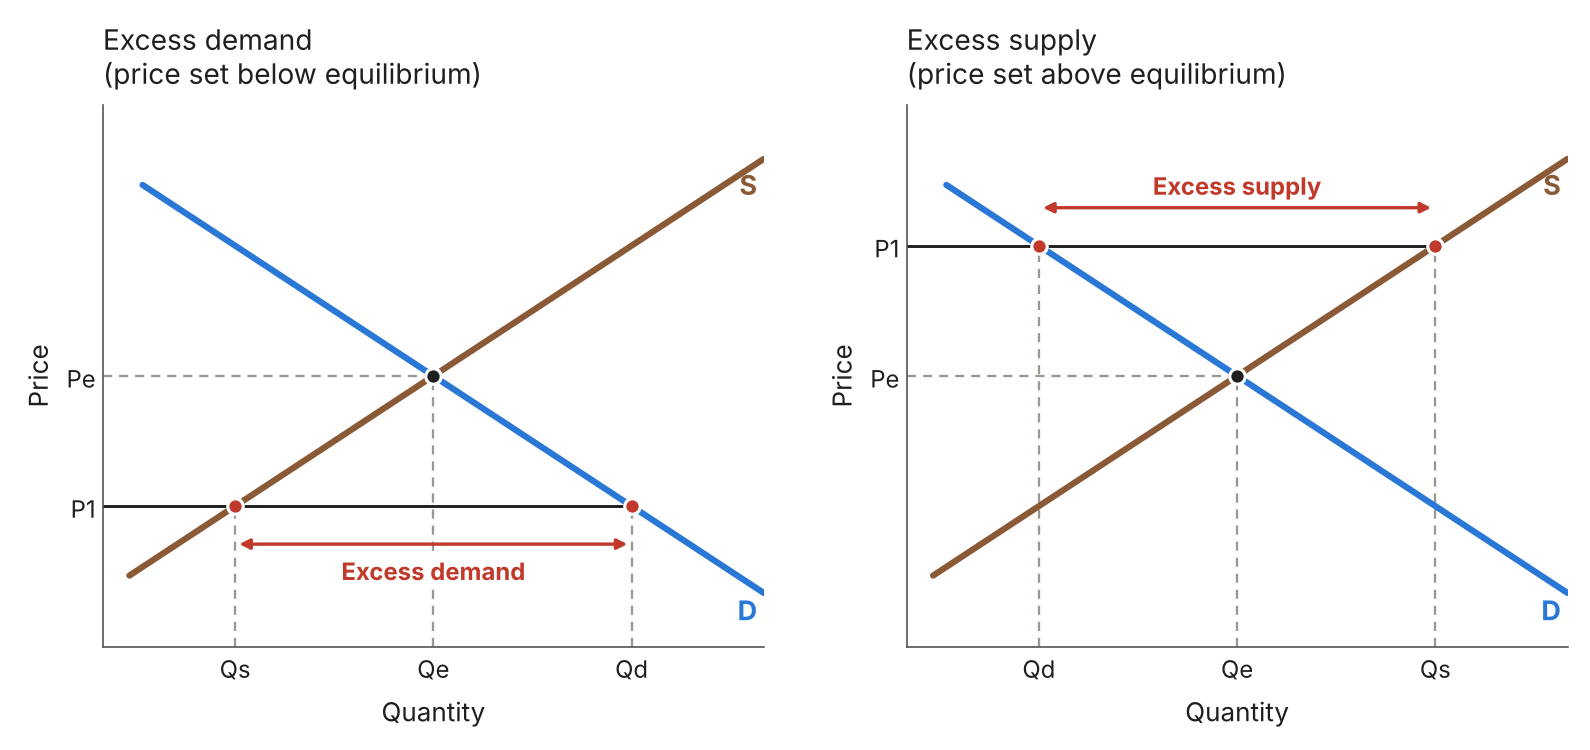
Figure 8: Excess demand and excess supply
1.1.4 Elasticity
Price inelastic demand: a steep curve. A big change in price causes a small change in quantity demanded.
Price elastic demand: a flat curve. A small change in price causes a big change in quantity demanded.
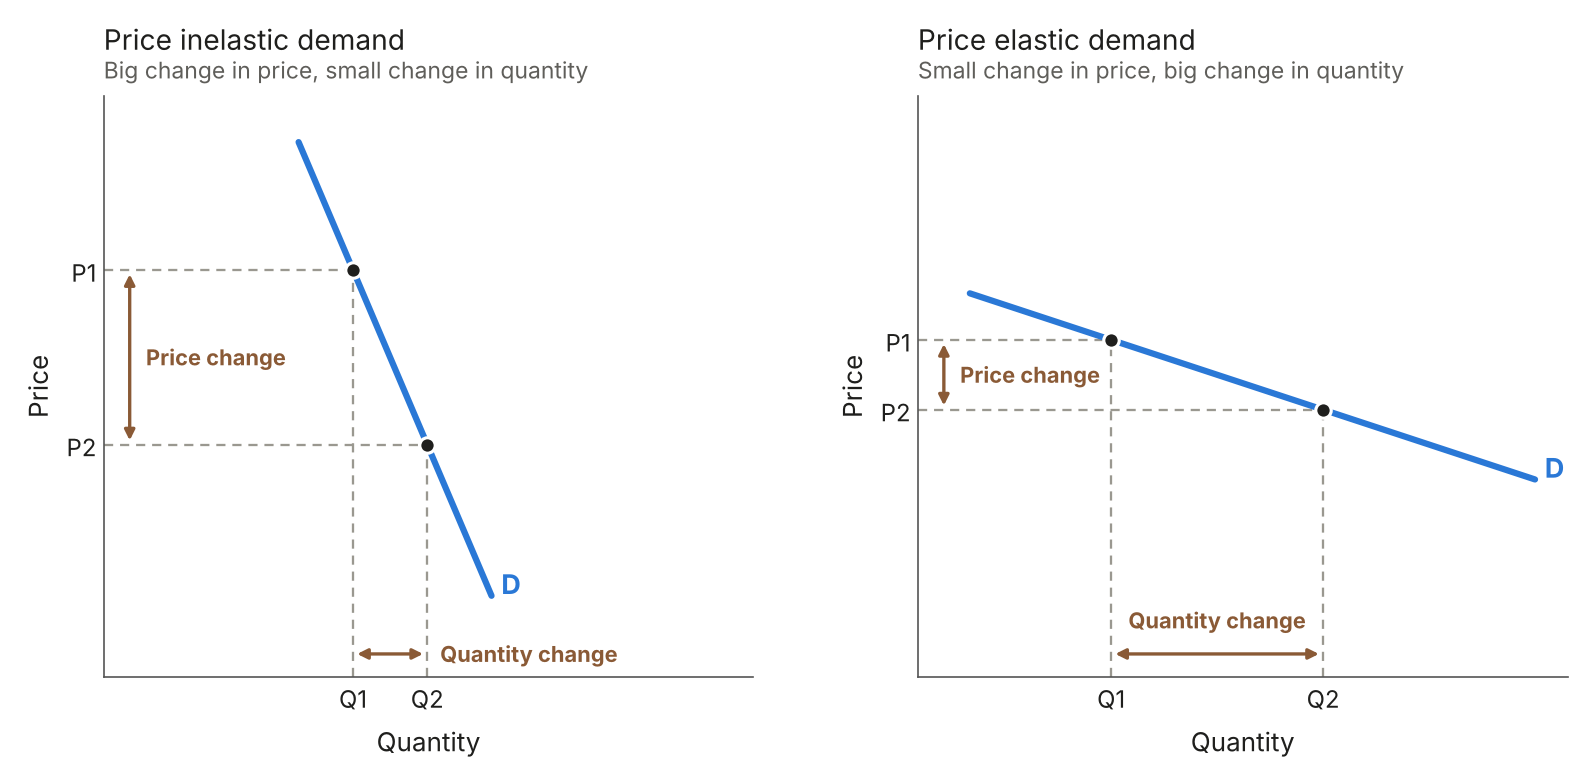
Figure 9: Price inelastic and price elastic demand
Perfectly inelastic: a vertical curve, where PED = 0.
Unitary elasticity: a curved line, where PED = –1.
Perfectly elastic: a horizontal line, where PED = infinity.
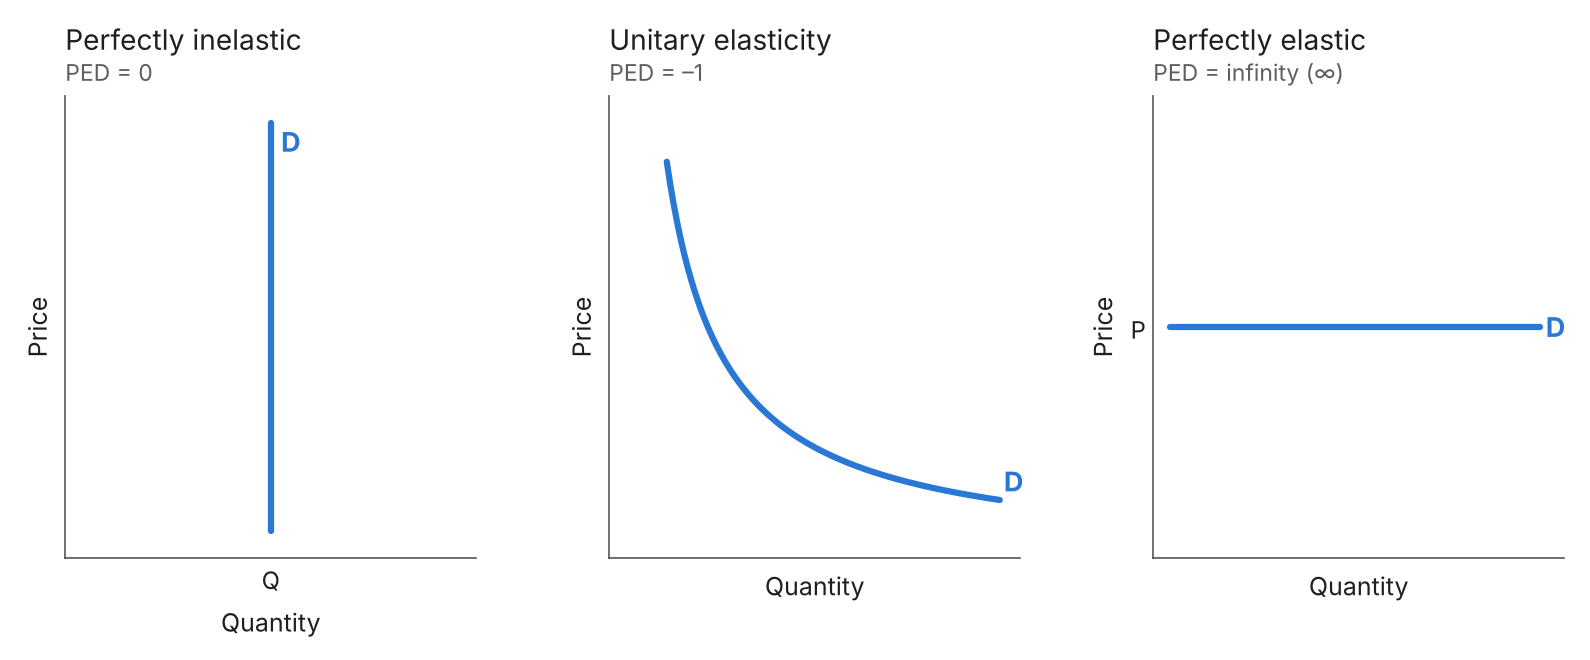
Figure 10: Special cases of price elasticity of demand
Price inelastic supply: a steep curve. A big change in price causes a small change in quantity supplied.
Price elastic supply: a flat curve. A small change in price causes a big change in quantity supplied.
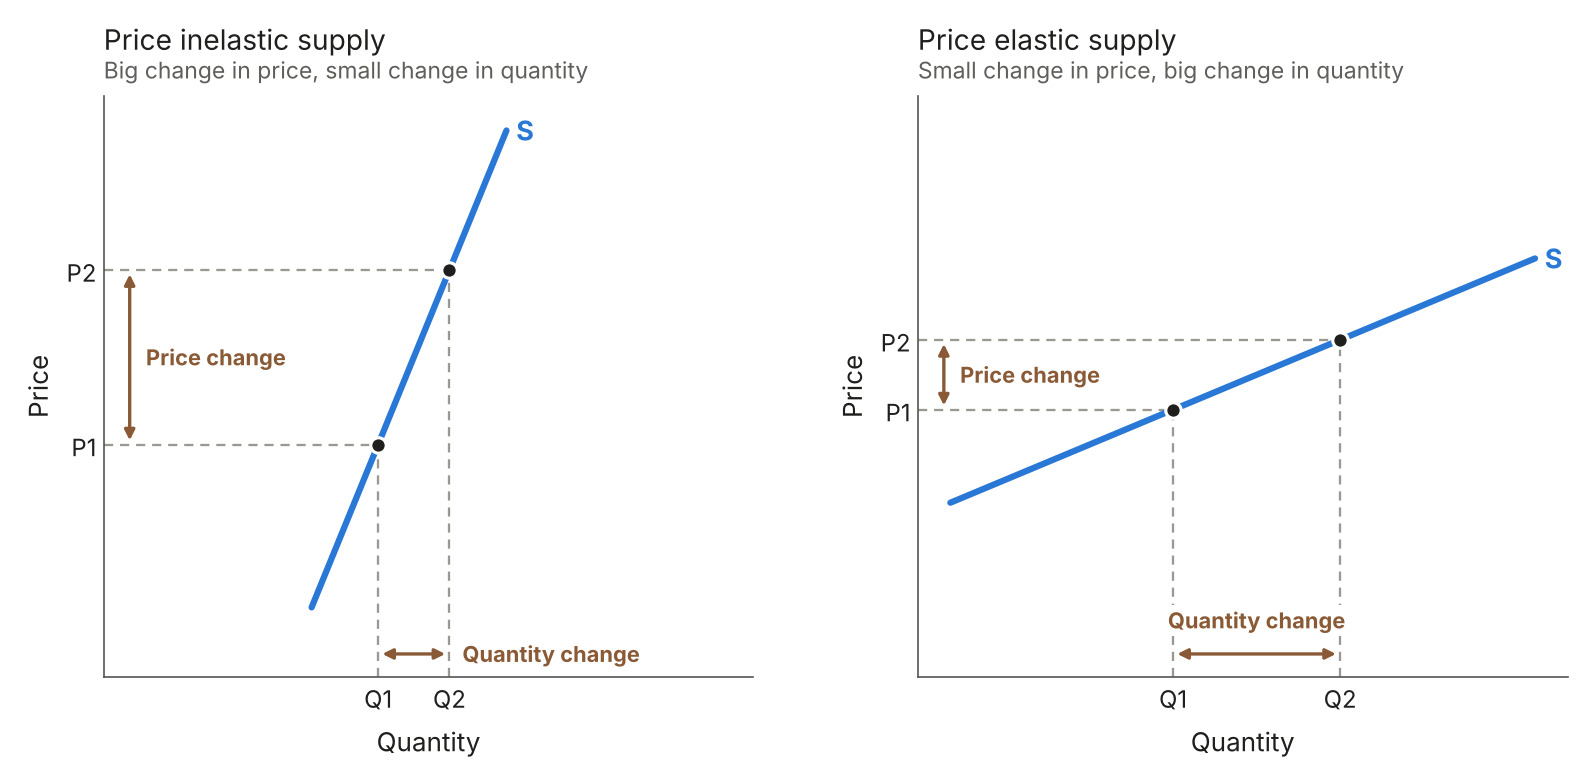
Figure 11: Price inelastic and price elastic supply
Perfectly inelastic: a vertical line, where PES = 0.
Unitary elasticity: a straight line starting from the origin, where PES = 1.
Perfectly elastic: a horizontal line, where PES = infinity.
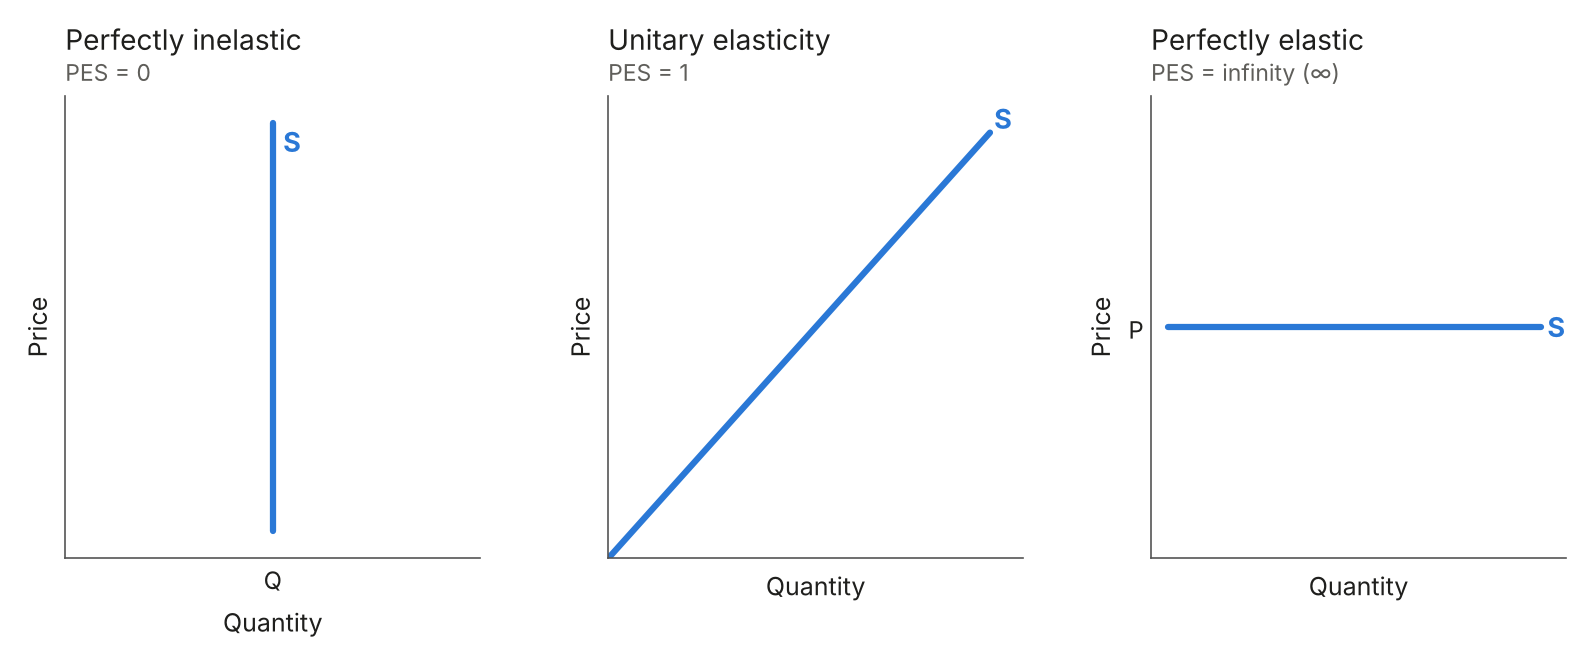
Figure 12: Special cases of price elasticity of supply
1.2 Business economics
1.2.1 Production
A developing economy: the primary sector employs the most people.
A developed economy: the tertiary sector employs the most people.
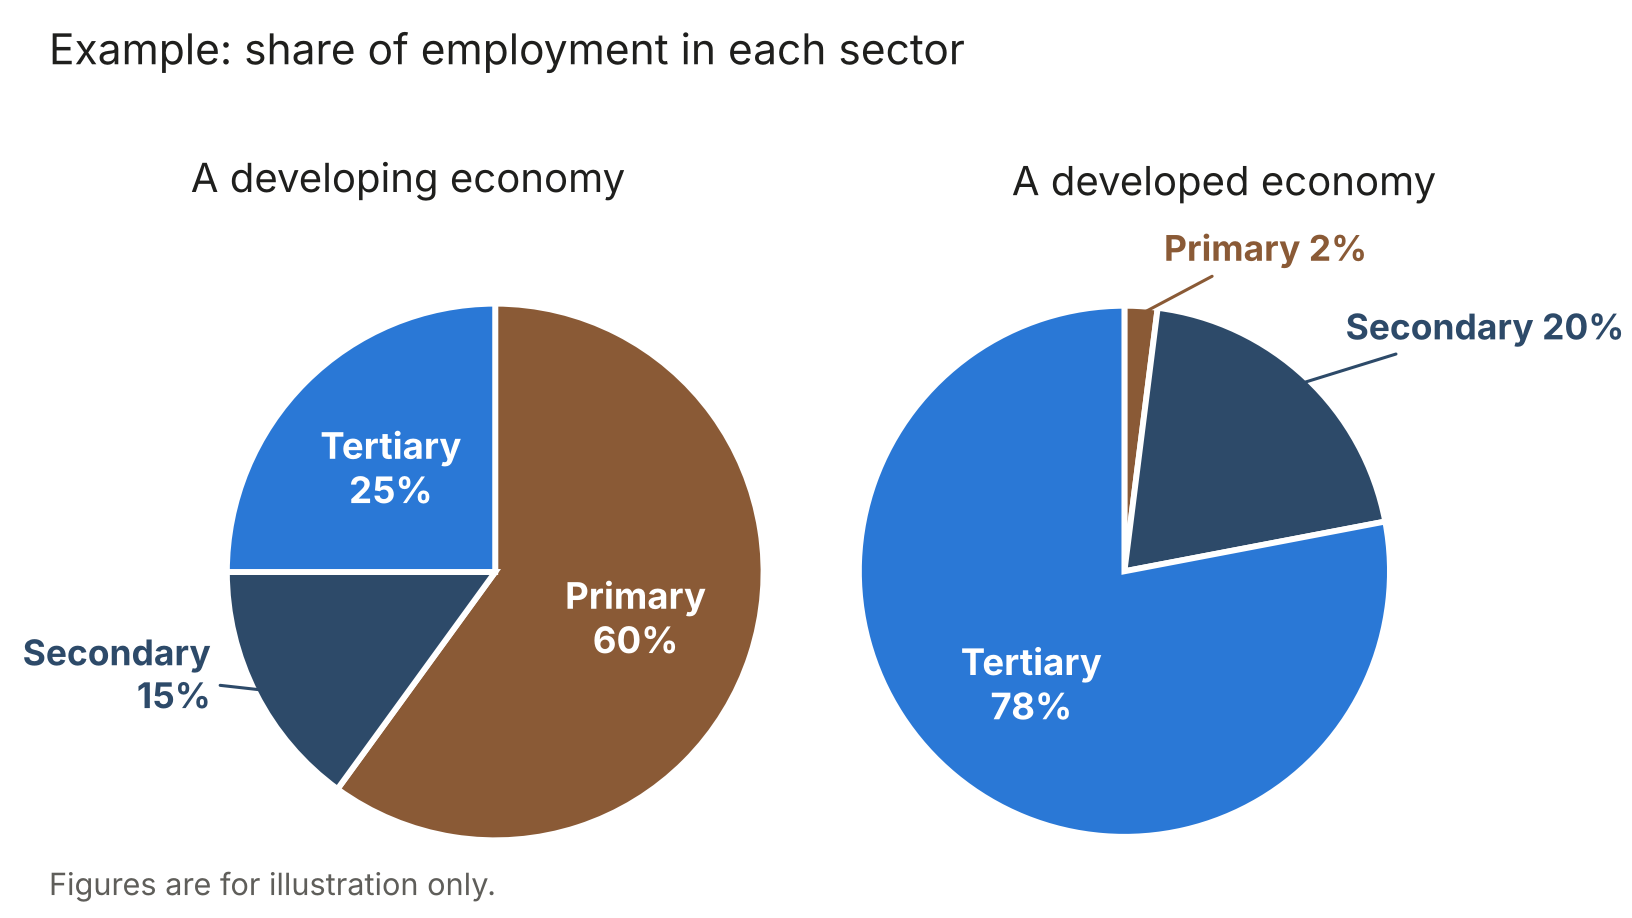
Figure 13: Share of employment in each sector
1.2.3 Economies and diseconomies of scale
The LRAC curve: how a firm’s average cost changes as it grows.
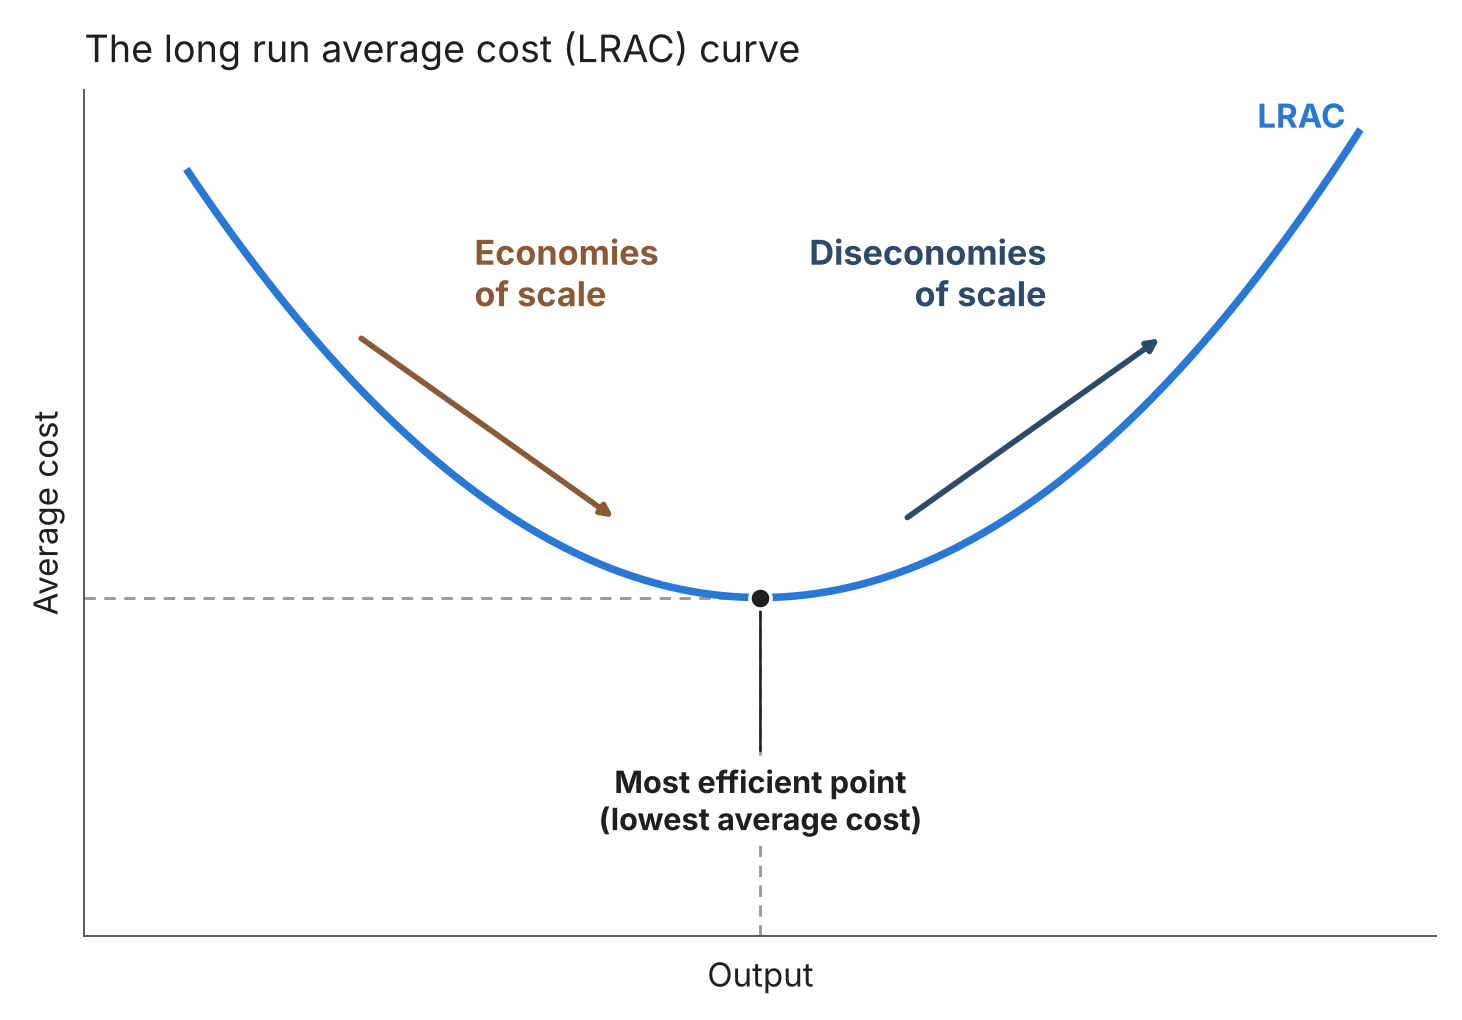
Figure 14: The long run average cost (LRAC) curve
1.2.5 The labour market
The labour market: the equilibrium wage rate (We) and employment (Qe) are where the demand for labour (DL) meets the supply of labour (SL).
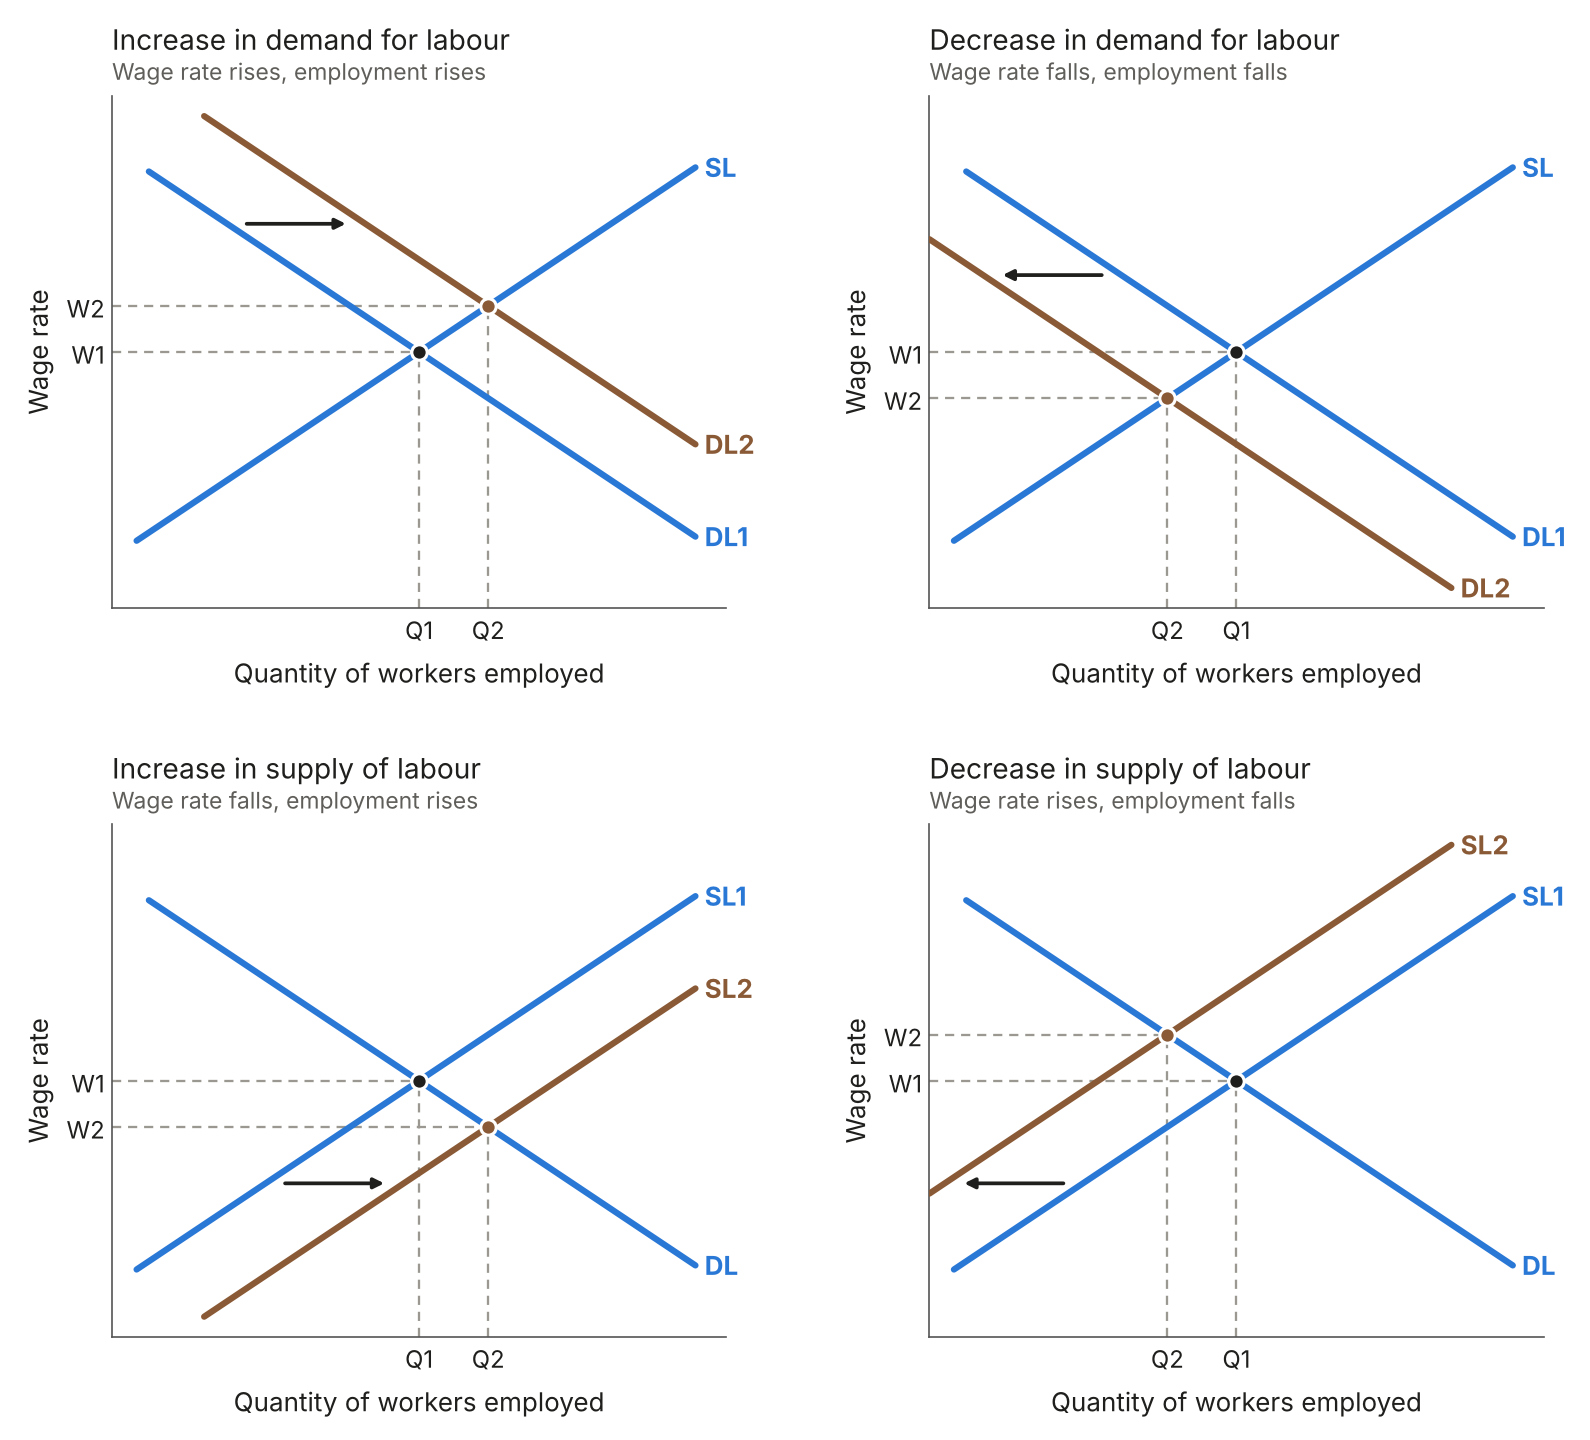
Figure 15: Wage determination in a labour market
Increase in demand for labour: the wage rate and employment both rise.
Decrease in demand for labour: the wage rate and employment both fall.
Increase in supply of labour: the wage rate falls and employment rises.
Decrease in supply of labour: the wage rate rises and employment falls.
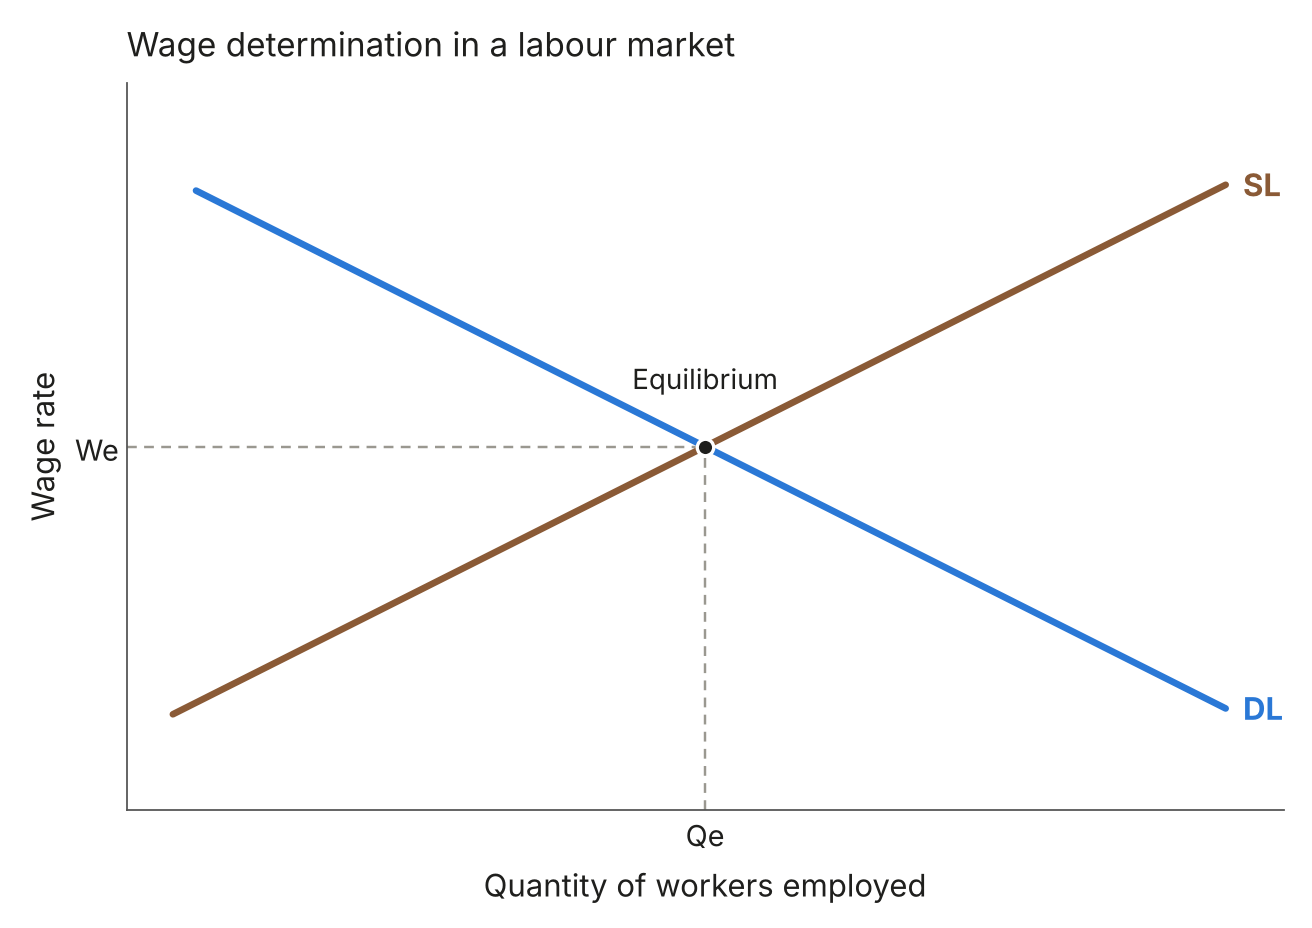
Figure 16: Shifts in the demand for and supply of labour
1.2.6 Government intervention
Introducing a minimum wage: set at W1, above the equilibrium wage rate (We).
Increasing the minimum wage: raised from W1 to W2.
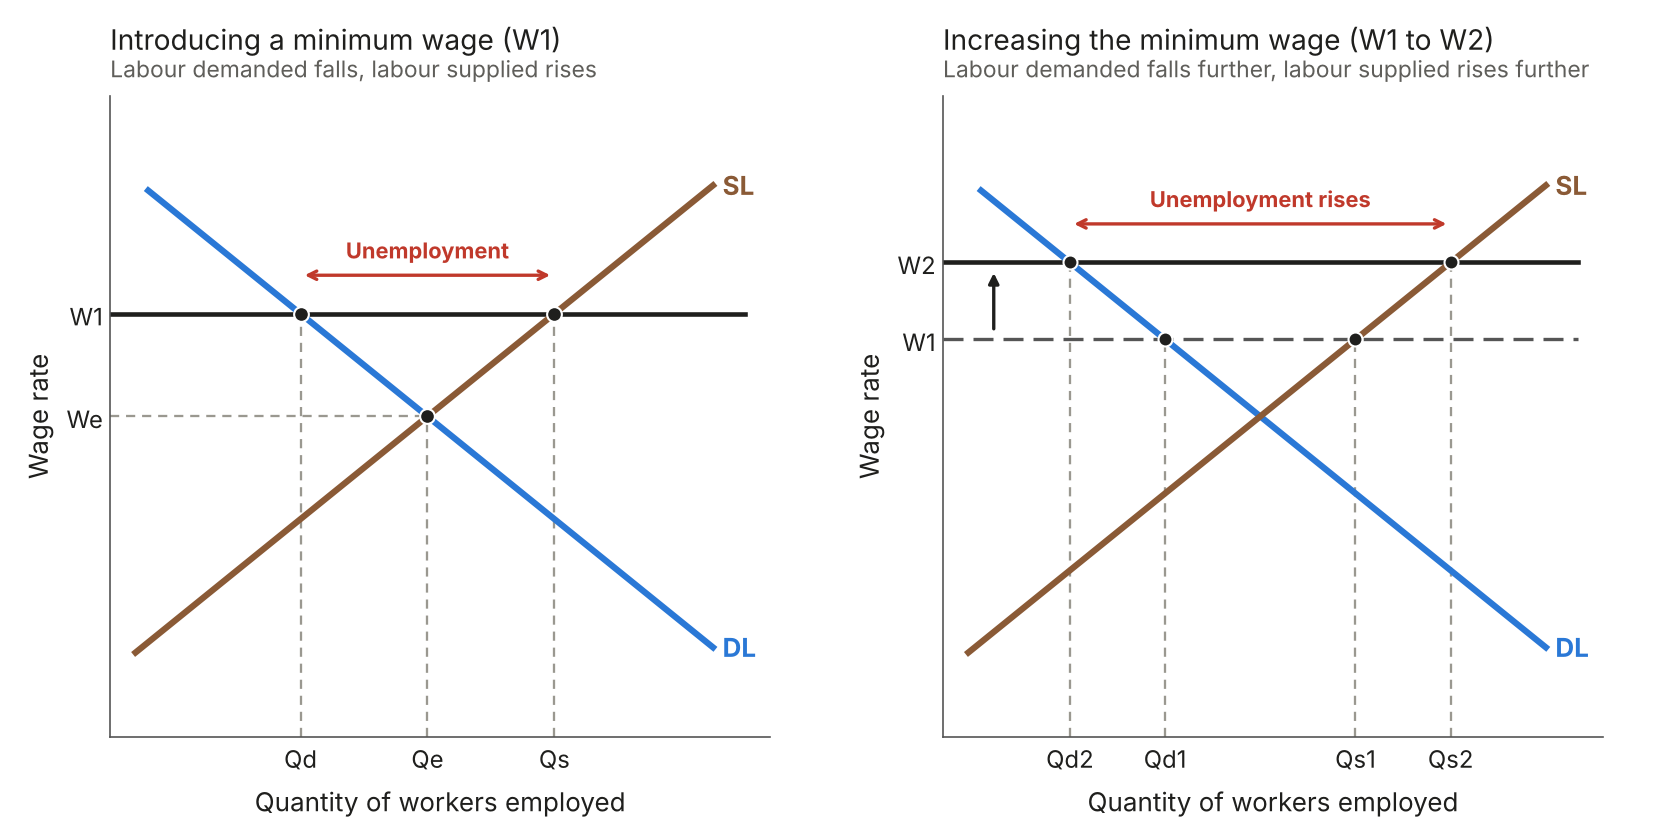
Figure 17: Introducing and increasing a minimum wage
2.1 Government and the economy
2.1.1 Economic growth
The economic cycle: real GDP rises and falls around its trend rate of growth.
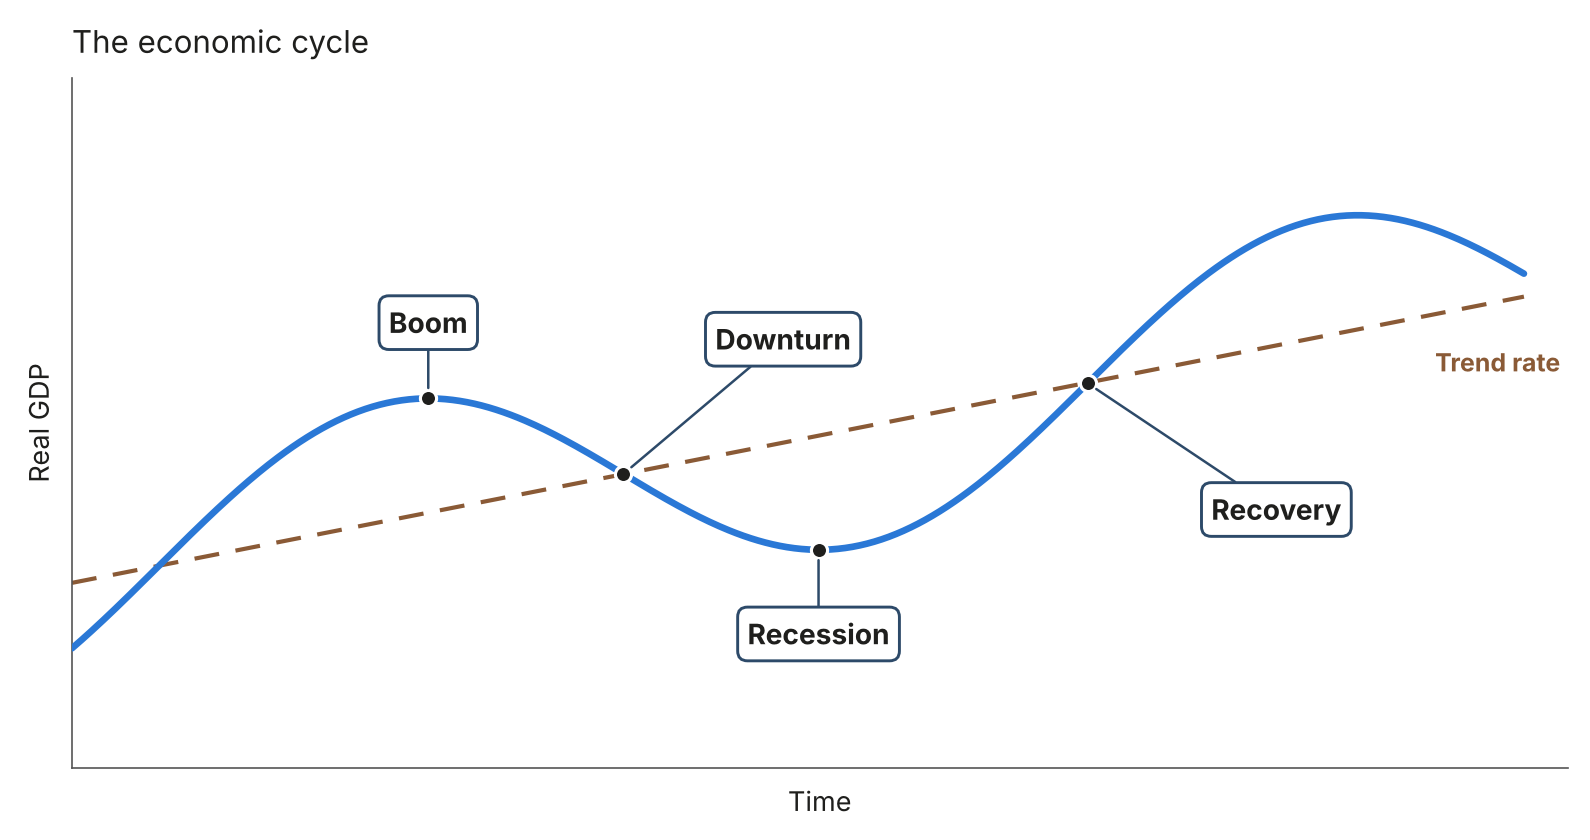
Figure 18: The economic cycle
2.1.2 Supply-side policy
Supply-side policies: the PPC shifts outwards from PPC1 to PPC2.
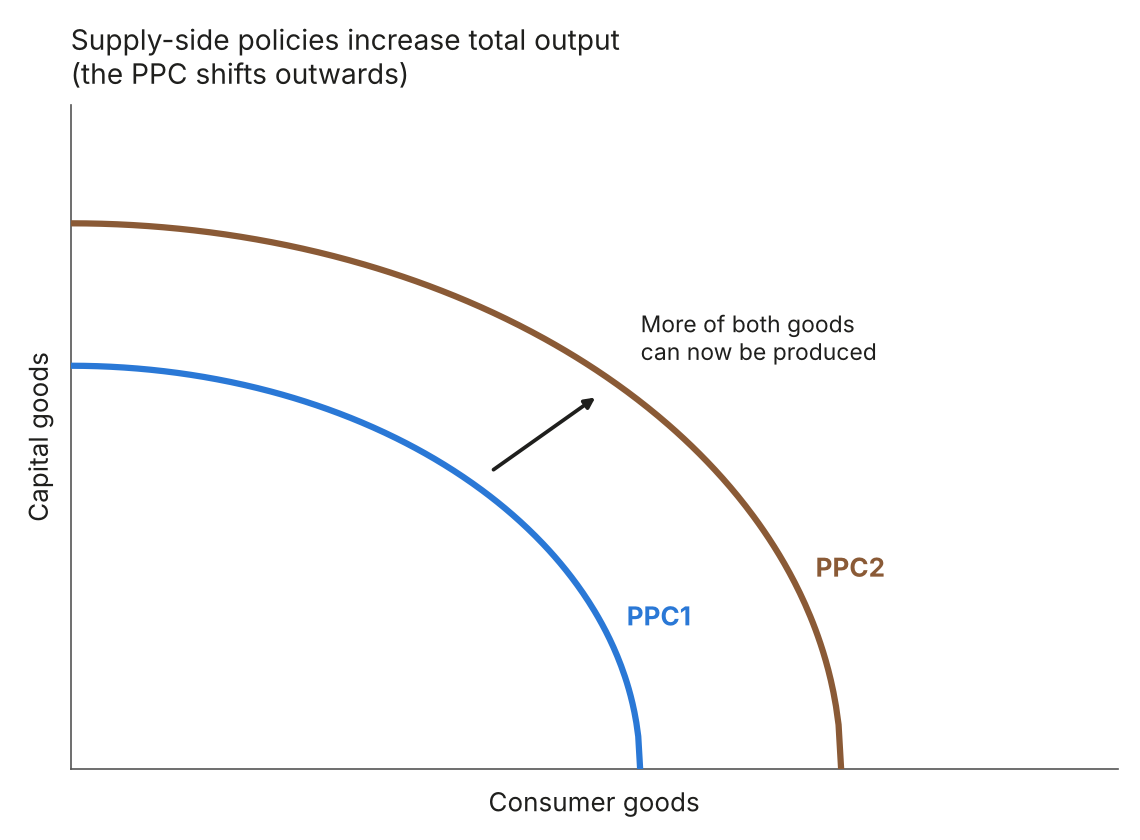
Figure 19: Supply-side policies and total output
2.2 The global economy
2.2.2 Methods of protection
Introducing a tariff: supply shifts left, so the price rises and the quantity falls.
Removing or cutting a tariff: supply shifts right, so the price falls and the quantity rises.
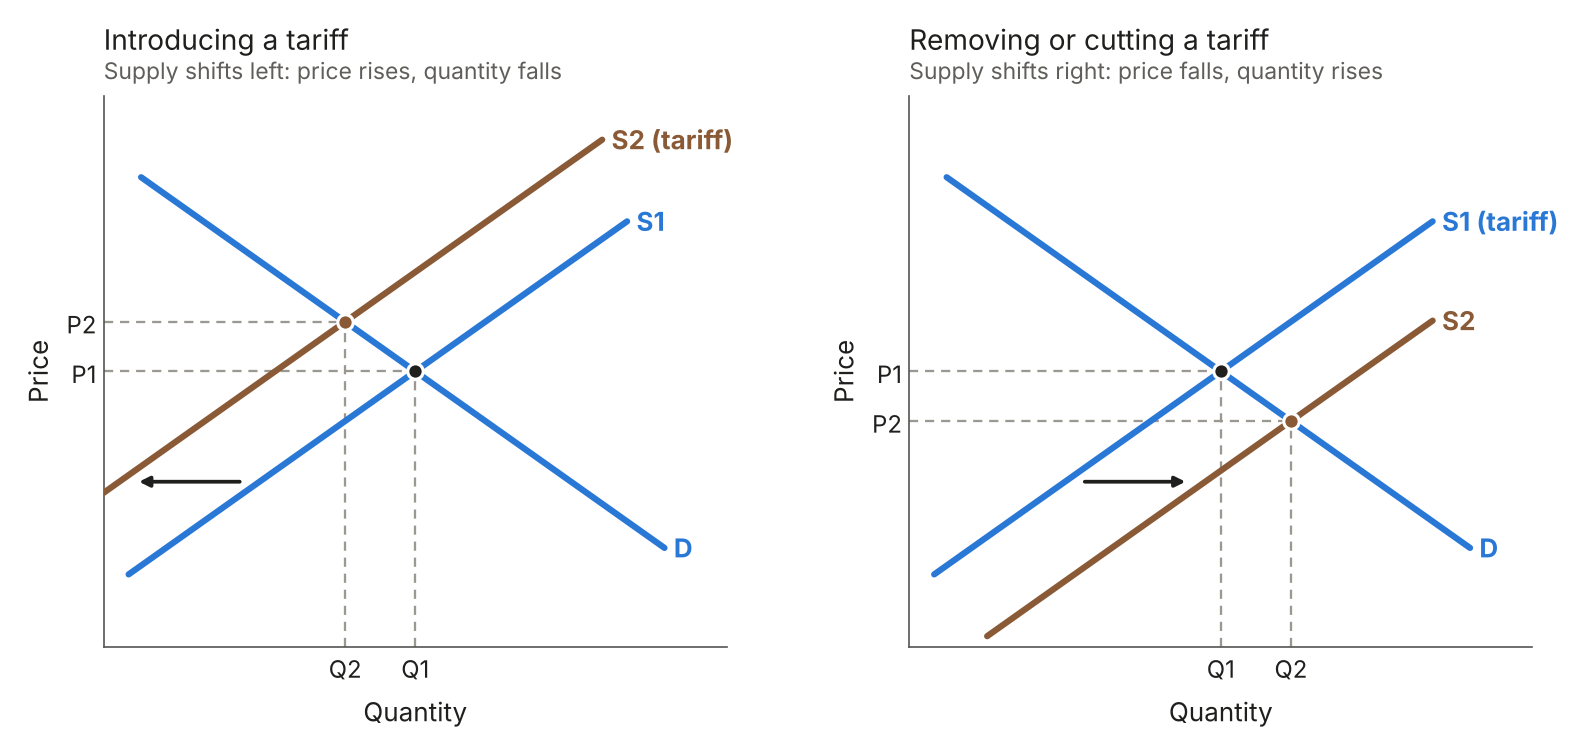
Figure 20: Tariffs
Introducing a quota: supply becomes a vertical line at the quota.
Increasing a quota: the vertical supply line shifts right.
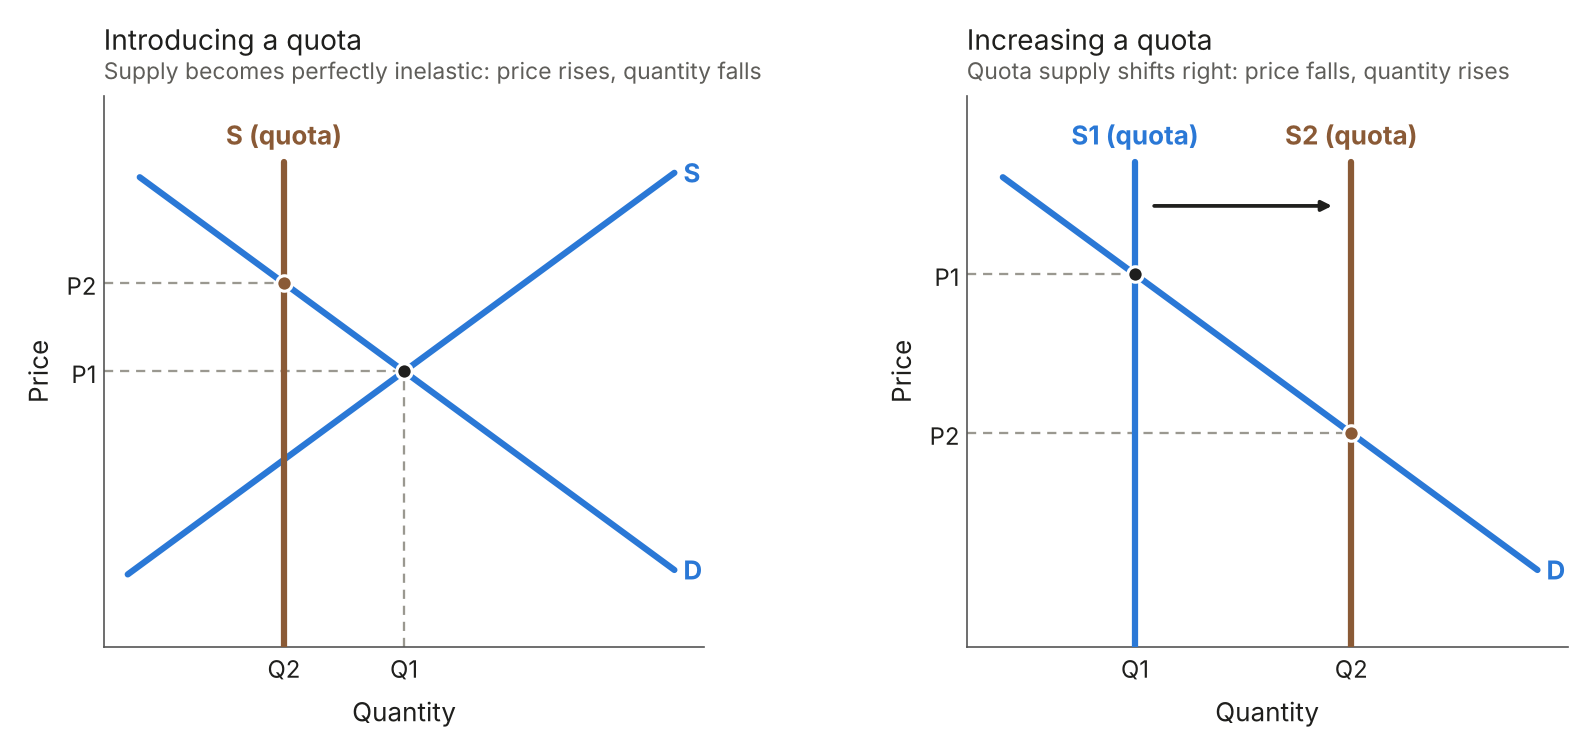
Figure 21: Quotas
Introducing a subsidy: supply shifts right, so the price falls and the quantity rises.
Removing a subsidy: supply shifts left, so the price rises and the quantity falls.
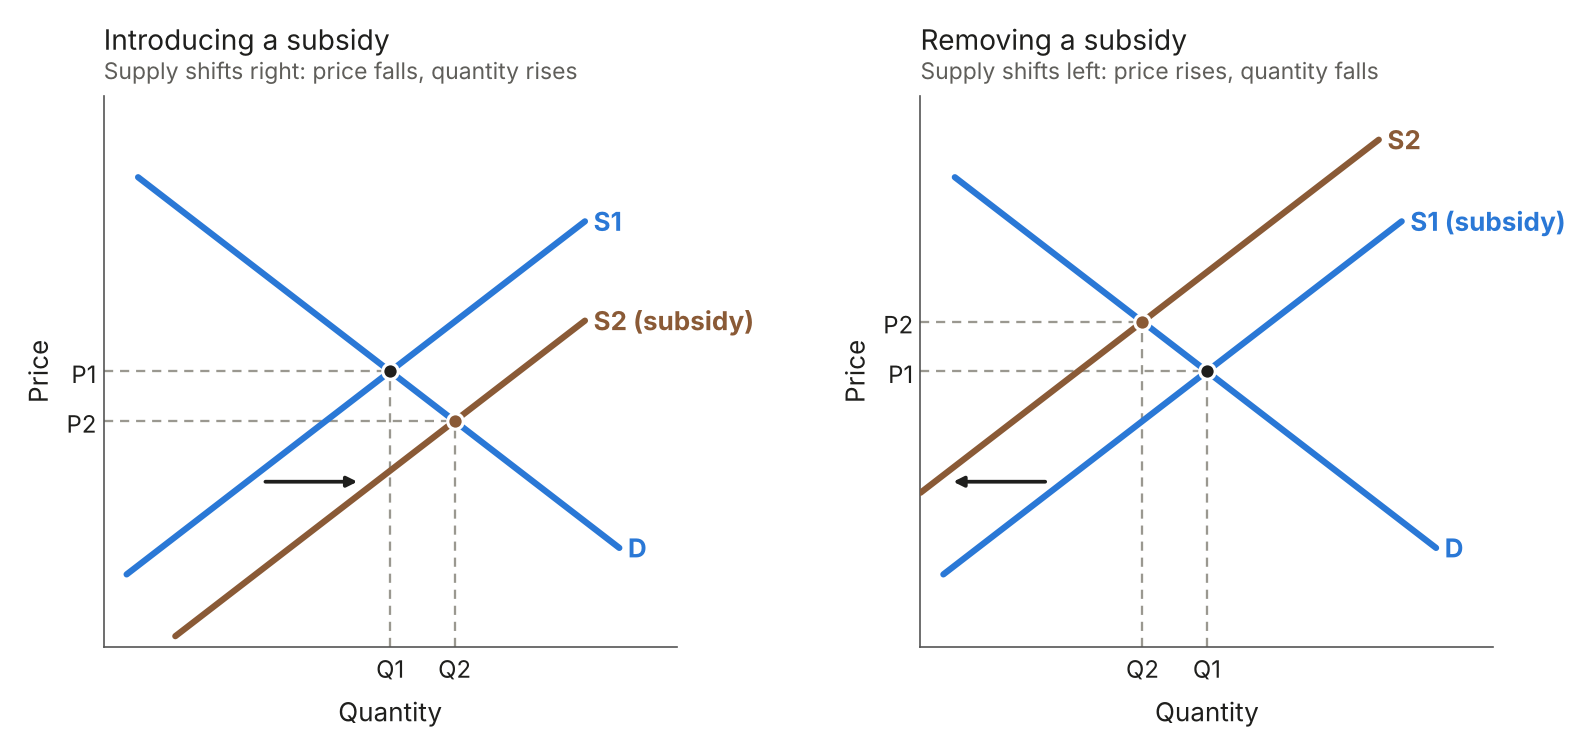
Figure 22: Subsidies
2.2.3 Exchange rates
The market for pounds: the exchange rate is set where the demand for pounds equals the supply.
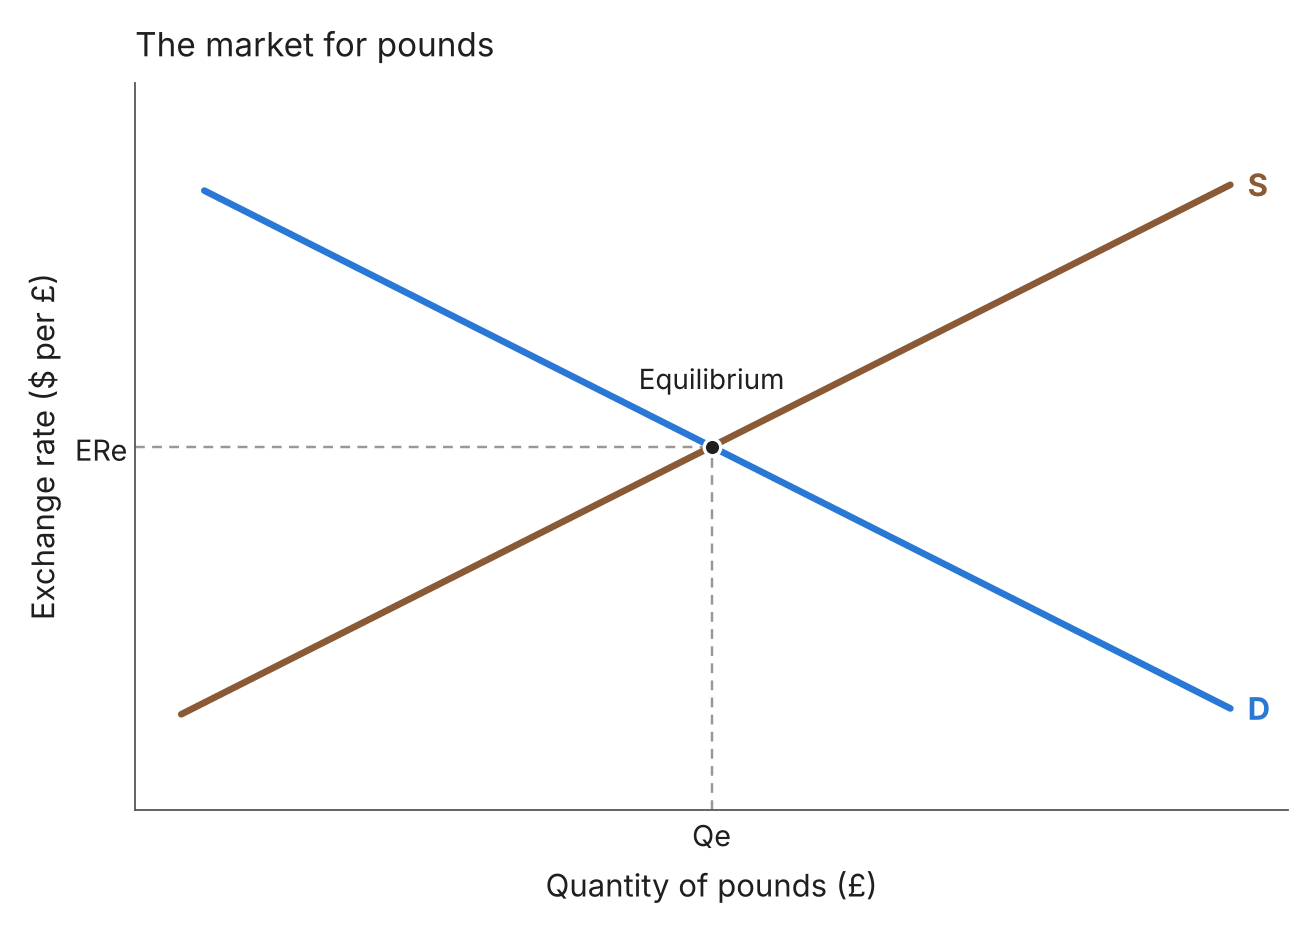
Figure 23: The equilibrium exchange rate
Increase in demand for pounds: the exchange rate rises.
Decrease in demand for pounds: the exchange rate falls.
Increase in supply of pounds: the exchange rate falls.
Decrease in supply of pounds: the exchange rate rises.
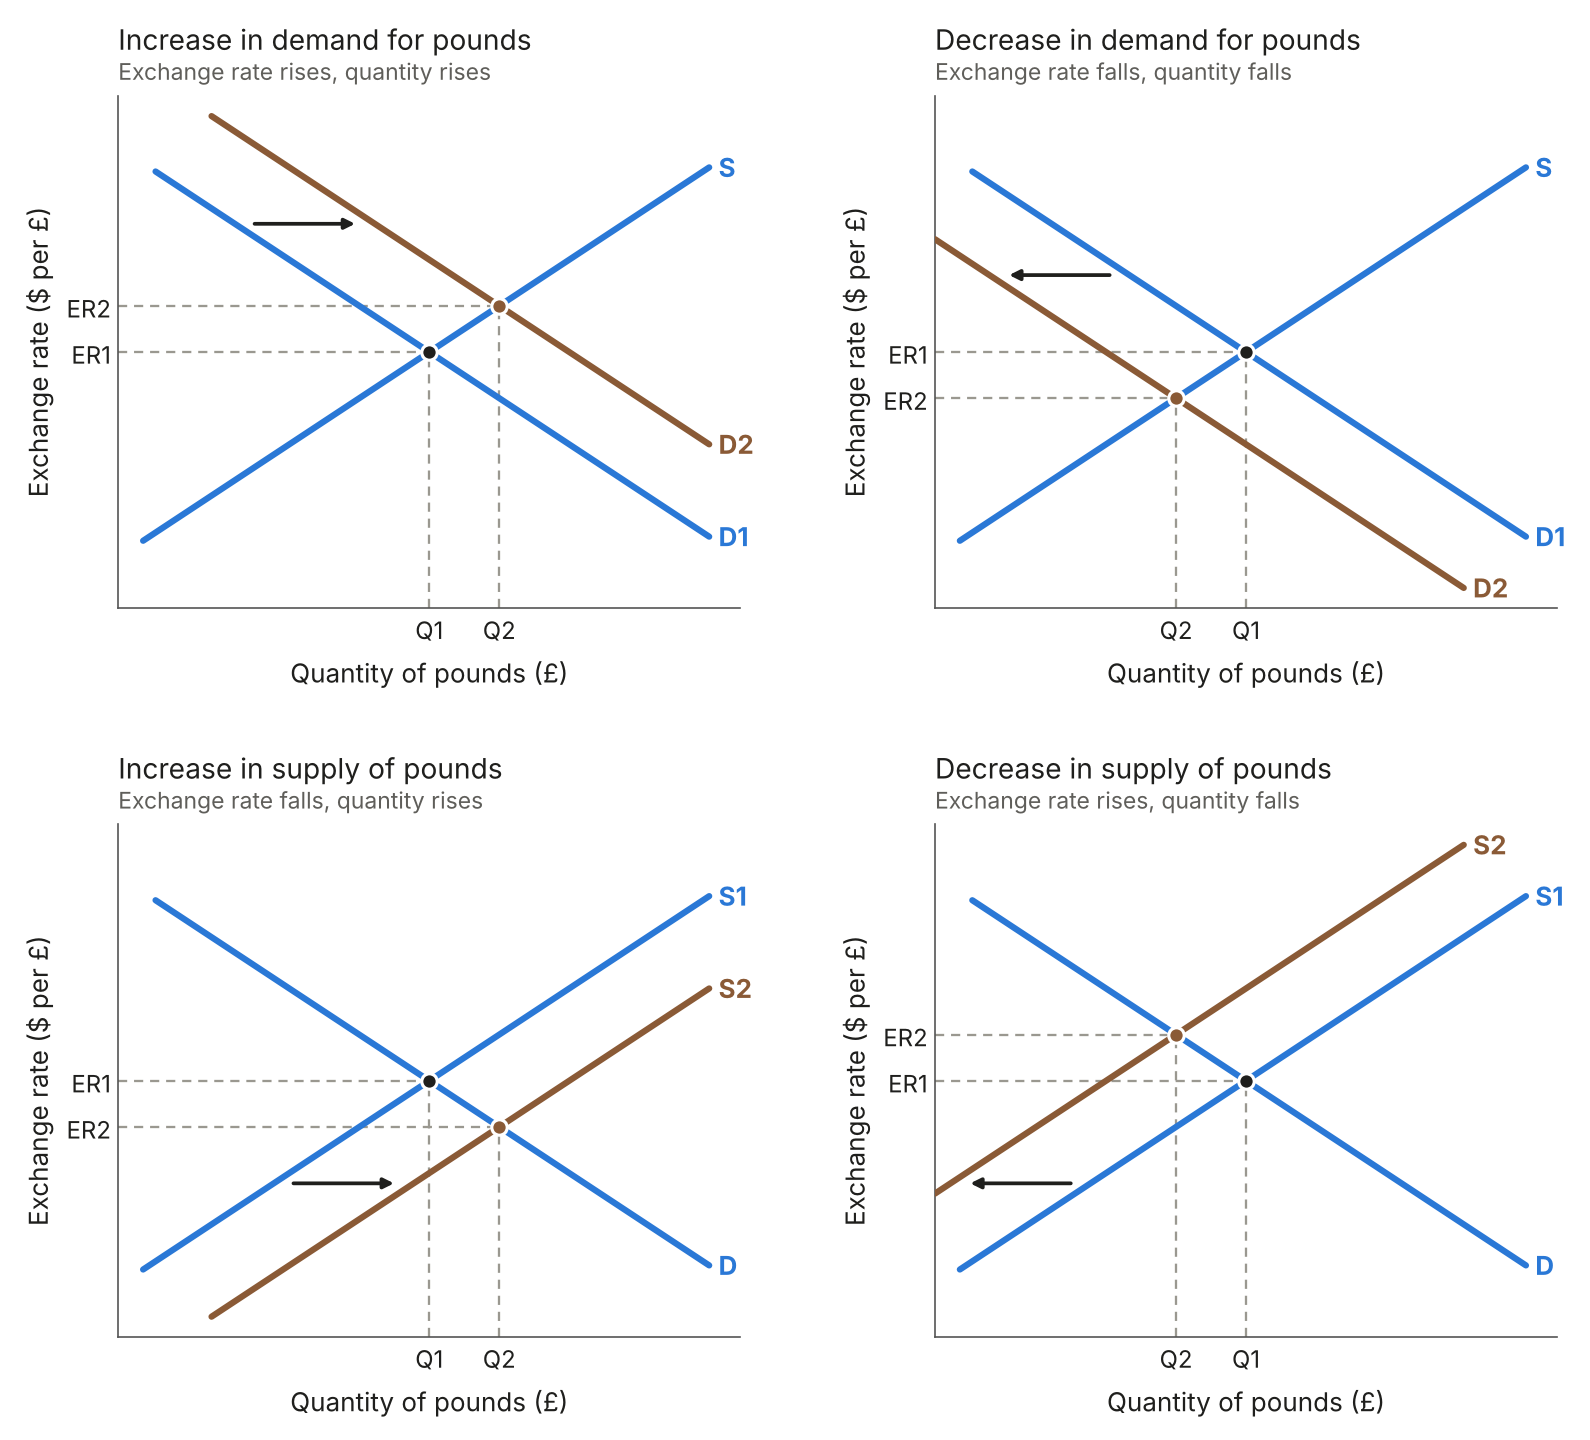
Figure 24: Shifts in the demand for and supply of a currency

